

Dive into the dynamic world of trading with our guide on the “Best Oscillators to Keep an Eye On.” Oscillators are invaluable tools for traders, providing crucial insights into market momentum and potential trend reversals. In this comprehensive exploration, we unveil a curated selection of oscillators that have proven to be instrumental in guiding trading decisions.
From the Relative Strength Index (RSI) to the Moving Average Convergence Divergence (MACD), we dissect each indicator’s nuances and applications. Join us in this illuminating journey as we equip you with the knowledge to harness these oscillators effectively, enhancing your trading prowess in the ever-evolving market.
Key Takeaways
- Relative Strength Index (RSI) is a widely used oscillator that measures the magnitude and speed of price movements, identifies overbought and oversold conditions, and helps gauge potential reversals in price trends.
- Moving Average Convergence Divergence (MACD) is a popular technical indicator derived from the difference between two moving averages. It is used to analyze market trends, identify buy/sell signals, and determine trend reversals and confirm trend strength.
- Stochastic Oscillator is used to identify overbought and oversold conditions by measuring the relationship between the closing price and price range. It helps identify potential trend reversals or continuations and is often combined with other indicators or used with trend analysis.
- Average Directional Index (ADX) helps identify the strength and direction of a market trend. It is calculated based on the difference between +DI and -DI, and higher ADX values indicate stronger trends. ADX can be used as a filter to identify trending markets, and crossovers of +DI and -DI lines with the ADX line indicate trend momentum.
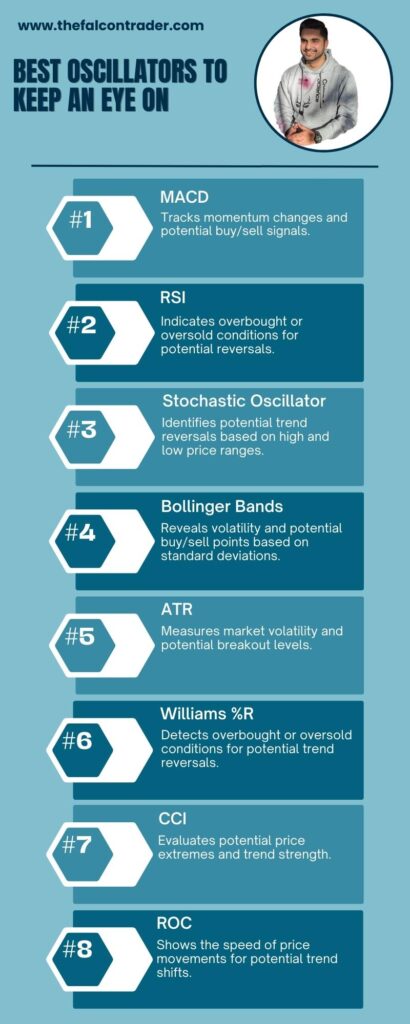
Best Oscillators To Keep An Eye On
The best oscillators to monitor in trading include the Relative Strength Index (RSI), Moving Average Convergence Divergence (MACD), Stochastic Oscillator, and the Commodity Channel Index (CCI).
Each of these indicators provides valuable insights into market trends, momentum, and potential reversal points. Traders often use a combination of these oscillators to make informed trading decisions.
Relative Strength Index (RSI)
The Relative Strength Index (RSI) is a widely used oscillator in technical analysis that measures the magnitude and speed of price movements to identify overbought and oversold conditions. It is a momentum indicator that compares the recent gains and losses over a specified period, typically 14 periods, to determine whether an asset is overbought or oversold. Traders use RSI as part of their trading strategies to gauge potential reversals in price trends.
One common approach in utilizing RSI is to consider levels above 70 as overbought and levels below 30 as oversold. When the RSI exceeds 70, it suggests that the asset may be due for a downward correction, indicating a possible sell signal. Conversely, when the RSI falls below 30, it implies that the asset may be undervalued and due for an upward correction, signaling a potential buy opportunity.
However, relying solely on these fixed levels can result in false signals during volatile market conditions. To enhance trading decisions using RSI, traders often incorporate additional technical indicators or chart patterns into their analysis.
Moving Average Convergence Divergence (MACD)
The Moving Average Convergence Divergence (MACD) is a popular technical indicator used by traders to analyze market trends and identify potential buy or sell signals.
The MACD indicator is derived from the difference between two moving averages, typically the 12-day and 26-day exponential moving averages.
Traders often employ various MACD trading strategies such as crossovers, divergences, and histogram analysis to make informed decisions in the financial markets.
MACD Indicator Explained
One widely used indicator in technical analysis is the Moving Average Convergence Divergence (MACD) oscillator. The MACD indicator is a trend-following momentum indicator that shows the relationship between two moving averages of a security’s price.
Here are some benefits of using the MACD indicator and how to use it effectively:
- Identifying Trend Reversals: The MACD can help traders identify potential trend reversals by showing bullish or bearish divergences between the indicator and price.
- Confirming Trend Strength: By analyzing the MACD histogram, traders can determine the strength of an existing trend. Higher histogram values indicate stronger trends.
- Generating Buy/Sell Signals: Traders often use signal line crossovers as buy/sell signals. When the MACD line crosses above/below the signal line, it generates a bullish/bearish signal.
- Setting Stop Loss and Take Profit Levels: The MACD can also be used to determine suitable stop loss and take profit levels based on previous market movements.
MACD Trading Strategies
A popular approach to utilizing the MACD indicator is through the implementation of various trading strategies. One commonly used strategy is the MACD crossover strategy, which involves identifying buy and sell signals based on the crossing over of the MACD line and signal line.
When the MACD line crosses above the signal line, it generates a bullish signal indicating a potential buying opportunity. Conversely, when the MACD line crosses below the signal line, it generates a bearish signal indicating a potential selling opportunity.
Another strategy involves interpreting the MACD histogram, which represents the difference between the MACD line and signal line. Traders look for positive or negative changes in histogram bars to identify shifts in momentum and potential entry or exit points.
| Strategy | Description |
|---|---|
| MACD Crossover | Buy when MACD Line crosses above Signal Line; Sell when MACD Line crosses below Signal Line |
| Histogram Interpretation | Look for positive/negative changes in histogram bars as indicators of momentum shifts |
Stochastic Oscillator
The Stochastic Oscillator is a popular technical analysis tool used to identify overbought and oversold conditions in the market. It measures the relationship between an asset’s closing price and its price range over a specific time period.
Interpreting Stochastic Oscillator signals involves analyzing the crossing of the %K line (the main line) and the %D line (a smoothed version of %K), as well as identifying divergences between price movement and oscillator readings.
To use the Stochastic Oscillator effectively, traders often combine it with other indicators or use it in conjunction with trend analysis to confirm potential reversals or continuations of trends.
Stochastic Oscillator Explained
Stochastic oscillator is a popular technical analysis tool used by traders and investors to assess the momentum and strength of a financial instrument. It compares the closing price of an asset to its price range over a given period, typically 14 days.
The calculation involves three main components: %K, %D, and smoothing. %K represents the current closing price relative to the highest high and lowest low over the chosen time frame. %D is a moving average of %K that helps smooth out fluctuations.
Traders often adjust the settings based on their trading style and preferences. Common settings include changing the time frame or using different periods for calculation.
Interpreting Stochastic Oscillator Signals
Interpreting the signals generated by the stochastic oscillator requires a careful analysis of the %K and %D values, as well as an understanding of the market conditions at that time. The stochastic oscillator is a popular technical indicator used by traders to identify overbought and oversold conditions in the market. By analyzing the relationship between the current closing price and its range over a specific period, it provides insight into potential trend reversals or continuations.
To interpret stochastic oscillator trends effectively, traders often look for certain patterns or signals. For instance, if the %K line crosses above the %D line from below, it may indicate a bullish signal and vice versa for bearish signals. Additionally, when both lines are in overbought or oversold territory (typically above 80% or below 20%, respectively), it suggests potential upcoming reversals.
The best timeframe for using the stochastic oscillator depends on individual trading preferences and strategies. Shorter timeframes such as hourly or daily charts can provide more frequent signals but may also generate more false positives. On the other hand, longer timeframes like weekly or monthly charts offer more reliable signals but with less frequency.
Table: Examples of Stochastic Oscillator Signals
| Signal | Interpretation |
|---|---|
| Bullish | %K crosses above %D line from below |
| Bearish | %K crosses below %D line from above |
| Overbought | Both lines are above 80% |
| Oversold | Both lines are below 20% |
Using Stochastic Oscillator Effectively
The Stochastic Oscillator is a popular technical analysis tool used by traders to identify potential market reversals. To effectively use the Stochastic Oscillator, it is crucial to understand and optimize its settings.
Here are some common mistakes to avoid when using the Stochastic Oscillator:
- Using default settings: The default settings of the Stochastic Oscillator may not be suitable for all trading conditions. It is important to adjust the settings based on the timeframe, asset, and market volatility.
- Overlooking divergences: Divergences occur when the price trend and oscillator’s movements diverge. Ignoring these signals can lead to missed opportunities or false trade signals.
- Trading against the trend: The Stochastic Oscillator works best in trending markets. Trading against the prevailing trend increases the risk of false signals and poor trading outcomes.
- Relying solely on oversold/overbought levels: While oversold and overbought levels can indicate potential reversal points, they should not be used as standalone entry or exit signals without considering other factors such as price patterns or support/resistance levels.
Average Directional Index (ADX)
One widely used oscillator in technical analysis is the Average Directional Index (ADX). The ADX is a trend indicator that helps traders identify the strength and direction of a market trend. It was developed by J. Welles Wilder Jr. and introduced in his book ‘New Concepts in Technical Trading Systems’ in 1978.
The ADX is calculated based on the difference between two other indicators, namely the Positive Directional Indicator (+DI) and Negative Directional Indicator (-DI). These indicators measure upward and downward movements, respectively. The ADX value ranges from 0 to 100, with higher values indicating a stronger trend.
Traders can use the ADX for various trading strategies. One common approach is to use it as a filter to identify trending markets before entering trades. For example, traders may choose to enter long positions when the ADX value is above a certain threshold, indicating a strong uptrend. Conversely, they may avoid or exit trades when the ADX indicates weak or no trend.
Another strategy involves using the crossover of +DI and -DI lines with the ADX line itself. When +DI crosses above -DI and the ADX is rising, it suggests an uptrend gaining momentum. Conversely, if -DI crosses above +DI while the ADX line is increasing, it indicates a developing downtrend.
Williams %R
Developed by Larry Williams, the Williams %R is a momentum oscillator used in technical analysis to identify overbought and oversold levels in a market. It measures the current closing price relative to the highest high and lowest low over a specified period. The value of the Williams %R ranges from -100 to 0, with readings above -20 indicating overbought conditions and readings below -80 indicating oversold conditions.
Using Williams %R effectively:
- Determine the time frame: Choose an appropriate time frame based on your trading style and objectives. Shorter time frames provide more frequent signals but can be more volatile, while longer time frames offer more reliable signals but may have fewer opportunities.
- Analyze crossovers: Look for crossovers of the -50 level as potential entry points. When %R crosses above -50, it suggests buying opportunities, while crossing below -50 indicates selling opportunities.
- Confirm with other indicators: Combine Williams %R with other technical indicators such as moving averages or volume analysis to validate signals and increase confidence in your trading decisions.
- Consider divergences: Pay attention to divergences between price action and Williams %R readings. Bullish divergence occurs when price makes lower lows while %R makes higher lows, signaling a potential reversal to the upside. Bearish divergence occurs when price makes higher highs while %R makes lower highs, suggesting a possible downturn.
By understanding how to use Williams %R effectively, traders can identify overbought and oversold conditions in the market, helping them make informed trading decisions based on momentum indications.
In addition to Williams %R, another popular oscillator used in technical analysis is the commodity channel index (CCI), which provides insights into cyclical trends and potential reversals in asset prices.
Commodity Channel Index (CCI)
Transitioning to the topic of the Commodity Channel Index (CCI), this oscillator is widely used in technical analysis to gain insights into cyclical trends and potential reversals in asset prices. The CCI measures the current price level relative to a moving average over a specified period of time, typically 20 periods. It oscillates between values above and below zero, indicating overbought and oversold conditions.
To better understand the significance of CCI in trading strategies, let’s compare it with another popular oscillator, the Relative Strength Index (RSI). Both indicators are momentum oscillators that help traders identify potential entry and exit points. However, there are some key differences between them.
The following table highlights some important distinctions between CCI and RSI:
| Criteria | Commodity Channel Index (CCI) | Relative Strength Index (RSI) |
|---|---|---|
| Measurement | Measures deviation from a moving average | Measures speed and change |
| Overbought/ Oversold Levels | Above +100 / Below -100 | Above 70 / Below 30 |
| Trading Strategy | Identifies cyclical trends | Identifies overbought/oversold conditions |
By analyzing these differences, traders can make informed decisions about which oscillator aligns better with their trading objectives.
Transitioning to the next section on ‘on-balance volume (OBV)’, we will explore another useful indicator for technical analysis.
On-Balance Volume (OBV)
The On-Balance Volume (OBV) indicator is a widely used tool in technical analysis that provides insights into the relationship between volume and price movements in an asset. Traders and investors rely on OBV to identify potential trends, confirm market reversals, and generate trading signals.
Here are four key aspects of OBV trading strategies and indicator interpretation:
- Trend confirmation: OBV can be used to confirm the direction of a trend. When the OBV line rises along with price, it suggests strong buying pressure and confirms an uptrend. Conversely, if the OBV line falls while prices rise, it indicates weakening buying pressure and may signal a potential downtrend.
- Divergence: Divergence occurs when the price of an asset moves in one direction while the OBV line moves in the opposite direction. This can indicate a potential reversal or change in trend.
- Breakout confirmation: Traders often use OBV to confirm breakouts from consolidation patterns such as triangles or rectangles. If the breakout is accompanied by an increase in OBV, it adds credibility to the move.
- Volume analysis: By analyzing changes in volume alongside price movements, traders can gain insights into market sentiment and strength. High volume accompanied by rising prices suggests bullishness, while high volume with falling prices indicates bearishness.
Understanding these aspects of OBV trading strategies and interpreting its indications allows traders to make informed decisions based on market dynamics rather than relying solely on price movements alone.
Conclusion
In conclusion, staying informed about the “Best Oscillators to Keep an Eye On” is vital for traders aiming to thrive in the ever-evolving financial markets. These oscillators serve as critical indicators, helping traders gauge market momentum and potential reversal points. By incorporating them into your trading toolkit, you gain a significant edge in making well-informed decisions.
As you embark on your trading journey, let this guide be your trusted resource, offering insights into the functionality and significance of these oscillators. With a keen eye on these indicators, you can enhance your trading strategy and navigate the markets with precision, ultimately leading to more successful and profitable trades.
References
- Heuristic based trading system on Forex data using technical indicator rules
- Technical indicators for forex forecasting: a preliminary study
- A Forex trading expert system based on a new approach to the rule-base evidential reasoning
- FOREX Trading and Investment
Frequently Asked Questions
What Is the Historical Background and Origin of the Relative Strength Index (RSI) Oscillator?
The historical background and origin of the relative strength index (RSI) oscillator are significant in understanding its practical applications. Its development can be traced back to J. Welles Wilder Jr.’s work in technical analysis during the late 1970s.
How Does the Moving Average Convergence Divergence (MACD) Indicator Work in Identifying Bullish or Bearish Trends?
The moving average convergence divergence (MACD) indicator is a technical analysis tool used to identify bullish or bearish trends in financial markets. It calculates the difference between two exponential moving averages, providing insights into market momentum and potential trend reversals.
Can the Stochastic Oscillator Be Used as a Standalone Indicator for Making Trading Decisions?
Using the stochastic oscillator for trend analysis can be beneficial due to its ability to identify potential reversal points. However, relying solely on this indicator for trading decisions may overlook other relevant factors, leading to suboptimal outcomes.
What Are the Key Differences Between the Average Directional Index (Adx) and Other Trend Strength Indicators Like the Rsi?
The key differences between the Average Directional Index (ADX) and other trend strength indicators, such as the Relative Strength Index (RSI), lie in their calculation methods and interpretation. Pros of using ADX include its ability to measure trend strength, while cons include its lagging nature. On the other hand, RSI offers insights into overbought or oversold conditions but may generate false signals in trending markets.
How Does the Commodity Channel Index (Cci) Indicator Help in Identifying Overbought or Oversold Conditions in the Market?
The Commodity Channel Index (CCI) indicator aids in the identification of overbought or oversold conditions in the market, serving as a valuable tool for traders. This differs from other oscillators such as the RSI oscillator.


