

Step into the world of technical analysis with the “Stochastic Indicator.” This powerful tool has earned its place as a cornerstone of market analysis, providing traders with invaluable insights into price momentum and potential trend reversals. By assessing the relationship between a security’s closing price and its price range over a specified period, the stochastic indicator offers a window into market psychology.
In this comprehensive guide, we’ll dissect the nuances of this essential indicator, exploring its applications, interpretations, and strategic implementations. Join us on this illuminating journey as we unravel the secrets of the stochastic indicator and equip you with the tools to navigate the dynamic landscape of financial markets.
Key Takeaways
- Stochastic Indicator is a momentum indicator used in technical analysis
- It helps identify potential turning points in markets and predicts future price trends
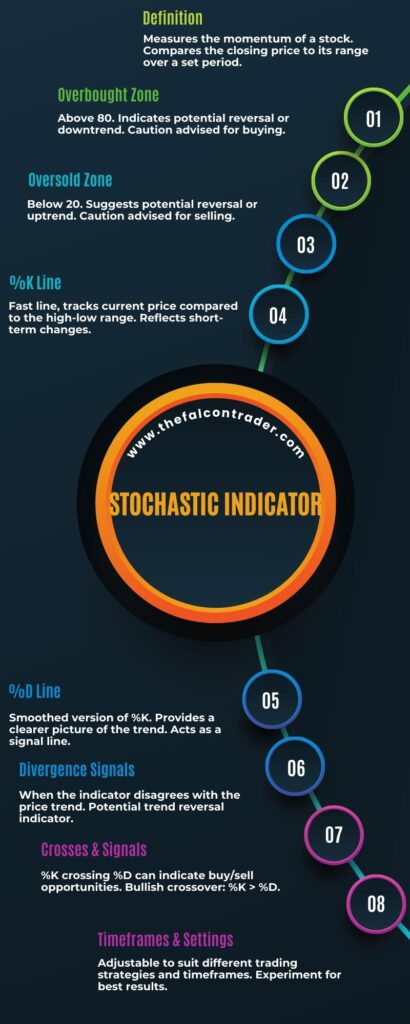
- It determines if a financial asset is overbought or oversold
- It provides timely signals for trading decisions and helps manage risks
What Is a Stochastic Indicator?
A stochastic indicator is a type of momentum indicator used to identify potential turning points in markets. Developed by George C. Lane, it is part of the broader area of technical analysis and helps traders analyze price action. This indicator compares an asset’s closing price to its price range over a given period, typically 14 days or periods. By doing so, the stochastic oscillator attempts to gauge the momentum of an asset’s recent performance and predict future trends in prices.
The main benefit of using this indicator is that it can help traders make better decisions when entering or exiting a trade by signaling whether an asset’s current direction may continue into the near future or reverse. When combined with other indicators or forms of analysis, such as support and resistance levels in markets, traders can use the stochastic indicator to get a more accurate view of market conditions before deciding where to place their trades.
The most important thing for traders to remember about using this tool is that it does not predict future prices precisely but rather provides an indication as to whether there may be continued buying pressure (indicated by higher highs) or selling pressure (indicated by lower lows). This information can then be used in combination with other forms of analysis for making informed trading decisions.

How Does a Stochastic Indicator Work?
By examining the price trend of a financial asset, one can identify whether it is overbought or oversold in the market. A stochastic indicator is an analytical tool used to make this determination and signal potential buying and selling opportunities. This type of technical indicator works by comparing a security’s closing price to its range of prices throughout a certain period.
Stochastic indicators measure the momentum of price movements as well as their direction, making them invaluable for traders. They are easy to interpret and use. They provide insight into whether an asset is undervalued or overvalued. They generate timely signals that enable investors to respond quickly. They have increased reliability compared to other methods due to their ability to absorb price divergence.
Overall, stochastic indicators are effective tools for gauging momentum changes and predicting future trends in financial assets. Their simplicity, accuracy, and speed make them particularly attractive for trading purposes. Furthermore, they help investors gauge when conditions are right for entering or exiting markets with greater confidence and success.
Examples of Stochastic Indicators
Stochastic indicators are a type of technical analysis indicator which can be used to observe the momentum and trends in price movements.
Two common examples of stochastic indicators are the Moving Average Crossover and Momentum Oscillator.
The Moving Average Crossover calculates two moving averages and compares them, while the Momentum Oscillator displays overbought/oversold levels by comparing the closing price to its range over a specified period of time.
These stochastic indicators can provide useful information for traders when making decisions on market entry and exit points.
Moving Average Crossover
Moving Average Crossover is a technical analysis tool which involves the comparison of two different moving averages, in order to identify potential trading opportunities. It is used by traders as a trend following strategy and can help them to set trailing stops. This technique looks at price data over specific periods of time and uses this data to calculate the average closing price.
Some key items for using Moving Average Crossover are:
- Identifying buying and selling signals
- Determining momentum shifts
- Noting when a security is overbought or oversold
- Calculating support and resistance levels.
Overall, Moving Average Crossover is an effective way of tracking a stock’s performance and making educated decisions regarding entry and exit points in the market.
The next section discusses Momentum Oscillators, which can be used in conjunction with this technique for further accuracy.
Momentum Oscillator
Momentum Oscillators are technical analysis tools used to measure the speed and strength of a price trend. They can be used to identify overbought/oversold levels, as well as generate buy/sell signals when combined with other indicators.
The oscillator is calculated by subtracting a longer-term moving average from a shorter-term moving average and plotting the difference between them on a chart. By analyzing the movement of this line, traders can determine whether momentum is increasing or decreasing in relation to the underlying price action and trend lines.
When momentum is positive, it indicates that recent prices have been higher than earlier prices, while negative momentum indicates that recent prices have been lower than earlier prices. This information can provide valuable insight into potential areas of support and resistance which could result in profitable trading opportunities.
With this knowledge, traders can make informed decisions about buying or selling securities at advantageous times.
Overbought/Oversold Levels
The use of Momentum Oscillators can provide insight into potential overbought/oversold levels. Using time frames, the oscillator signals can help traders identify market turning points and divergence trading opportunities.
Traders should be aware of these indicators when monitoring prices:
- Moving averages to determine trend strength;
- Maximums and minimums that indicate price exhaustion;
- Divergence between the oscillator and price action;
- Support/resistance levels that signal a reversal in sentiment.
Analyzing these conditions within the context of different time frames allows traders to more accurately assess market momentum, aiming for optimal entry/exit points with higher confidence.
Benefits of Using a Stochastic Indicator
Utilizing a stochastic indicator can provide numerous benefits to traders. Risk management and trading strategies are improved when using a stochastic indicator, as it tracks the momentum of asset prices in order to identify potential turning points. A trader can then use this data to their advantage by making more informed decisions that could lead to better returns on investment.
| Benefit | Description | Example |
|---|---|---|
| Improved Risk Management | Stochastic indicators help identify overbought/oversold levels, allowing traders to control risk better and set stop-loss orders accordingly. | Setting stop-losses at overbought or oversold levels ensures that significant losses are minimized if the market suddenly reverses directions. |
| Trading Strategies Optimization | By recognizing potential turning points in an asset’s price, traders can create more effective trading strategies based on these insights. | Using a stochastic indicator, traders could watch for areas where an asset is oversold and then buy into it at the right time before its price rises again. |
| Greater Returns on Investment (ROI) | When used properly, a stochastic indicator can be beneficial in helping traders earn higher ROI from their trades. | By entering positions at certain points based on the signals provided by the indicator, investors may be able to obtain better returns than they would have without using one at all. |
Setting Up a Stochastic Indicator
Setting up a Stochastic Indicator requires consideration of two key parameters: Parameters Setup and System Optimization.
Parameters Setup refers to the selection of the appropriate settings for the indicator, such as time frames, signal levels and other relevant technical indicators.
System Optimization involves adjusting variables in order to maximize profits while minimizing risk.
It is important to understand these components thoroughly in order to develop an effective trading strategy using a Stochastic Indicator.
Parameters Setup
Parameters of a stochastic indicator must be properly configured for accurate results. There are four key components to consider when setting up the parameters:
- Technical Analysis: understanding how indicators move in relation to price movements, as well as analyzing historical data.
- Risk Management: determining an appropriate level of risk and determining stop-loss levels.
- System Optimization: ensuring that all settings are optimized for trading objectives.
- Data Collection: collecting and analyzing data from different sources.
Properly configuring the parameters of a stochastic indicator can help traders make informed decisions and mitigate risks.
Transitioning into system optimization is essential to ensure successful trades.
System Optimization
Optimizing system parameters is an essential step for successful trading. Machine learning and genetic algorithms can be used to optimize a stochastic indicator system for maximum performance. By creating a mathematical model of the data, machine learning can detect patterns in the markets that could not be found by manual analysis.
Additionally, genetic algorithms provide an efficient way to search through possible solutions from a large set of parameters and find optimal settings. The use of these tools helps traders gain insight into their strategies and fine tune them for better results.
Through this process, traders can increase their chances of success while minimizing risk exposure.
Interpreting a Stochastic Indicator
Interpreting a stochastic indicator requires an understanding of the underlying market conditions. An effective strategy includes risk management, signal accuracy, data analysis, and an understanding of how these indicators are used. It is important to understand the different types of stochastic indicators available in order to make informed decisions when trading.
Risk management should be at the forefront of any trader’s strategy as it can help mitigate losses while maximizing gains. Signal accuracy is also important as traders need to ensure they are accurately interpreting signals from the stochastic indicator and making sound trading decisions based on that information. Data analysis is essential for a trader to understand trends in the market and how their trades will impact those trends.
In addition, it is important for traders to understand how different types of stochastic indicators work and what they signify in terms of market movements. By learning about various types of stochastics, traders can use this knowledge to create more accurate strategies for trading with them.
Lastly, understanding how these indicators fit into an overall trading plan can help guide traders as they navigate markets and determine when it might be best to enter or exit positions.
Challenges of Using a Stochastic Indicator
Using a stochastic indicator can present certain challenges for traders, including data analysis and signal accuracy. One of the most important difficulties in using a stochastic indicator is noise filtering; without proper noise filtering, it can be difficult to identify meaningful trends or signals. Additionally, traders must ensure that the signals generated by their stochastic indicator are accurate and reliable.
| Challenge | Description | Solution |
|---|---|---|
| Noise Filtering | Identifying meaningful trends from random market movements | Use indicators such as moving averages to filter out noise and identify true trends from random market movements |
| Signal Accuracy | Ensuring that the signals generated by the stochastic indicator are reliable and accurate | Use multiple technical indicators together to increase the reliability of signals generated by the stochastic indicator |
Alternatives to Stochastic Indicators
Analyzing market data can be done through alternative methods to stochastic indicators. Examples of such alternatives include:
- The Relative Strength Index (RSI) which is a momentum indicator used to compare the magnitude of recent gains and losses over a specific period.
- The Commodity Channel Index (CCI), which is a technical indicator that helps traders identify cyclical trends in the market.
- MACD, or Moving Average Convergence Divergence, which is an oscillator used to measure momentum.
- And Bollinger Bands, a volatility indicator composed of three lines.
Each of these indicators offer their own advantages and drawbacks for trading purposes and should be carefully studied before making decisions on how to best analyze market data.
By understanding these various alternatives, investors can make more informed economic decisions based on their individual needs.
Conclusion
In conclusion, the “Stochastic Indicator” stands as a beacon for traders seeking to decipher market dynamics and identify potential turning points. Its ability to gauge the relative strength of a trend is a priceless asset in the arsenal of any technical analyst. However, it’s crucial to combine the stochastic indicator with other indicators and employ effective risk management strategies.
As you delve into the world of technical analysis, let this guide be your steadfast companion, offering valuable insights and empowering you to make informed trading decisions. With a firm grasp of the stochastic indicator, you’ll be well-positioned to navigate the complexities of financial markets and seize opportunities with confidence.
References
- A Forex trading system based on a genetic algorithm
- A Forex trading expert system based on a new approach to the rule-base evidential reasoning
- Lessons from the evolution of foreign exchange trading strategies
- Application of neural network for forecasting of exchange rates and forex trading
Frequently Asked Questions
What Is the Difference Between a Stochastic Indicator and a Regular Indicator?
Regular indicators are based on price data and do not take into account the probability of a trade outcome. Stochastic indicators, on the other hand, incorporate probability to analyze market movements and predict future trends in order to enable more effective risk management and trading strategies.
How Often Should I Use a Stochastic Indicator to Receive the Most Accurate Results?
Analyzing market trends through technical analysis can help determine the best frequency of using a stochastic indicator. Data-driven decisions can reveal the most accurate results, allowing for informed decision-making to ensure success in the long term.
Is a Stochastic Indicator Better for Short-Term or Long-Term Analysis?
Price movements and market trends can be analyzed over short-term or long-term periods. A stochastic indicator is often used to measure these changes in data, providing insight into the direction of the markets. Such analysis can help traders make informed decisions about their investments.
Is It Possible to Combine a Stochastic Indicator With Other Indicators?
It is possible to combine a stochastic indicator with other indicators, such as those that generate overbought/oversold signals or measure momentum swings. By doing so, investors can gain more insight into market behavior and make more informed decisions. Data-driven analysis of these combined indicators should help traders better anticipate shifts in the market and potentially identify profitable trading opportunities.
Do I Need to Be an Experienced Trader to Understand the Results of a Stochastic Indicator?
Navigating trading strategies and risk management can be a daunting task, even for experienced traders. Understanding the results of a stochastic indicator requires an in-depth analysis of market trends – something that may prove difficult to grasp without proper knowledge. However, with dedication and effort, anyone can gain the skills necessary to make informed decisions.


