

Step into the dynamic realm of intraday trading with the “RSI Intraday Strategy.” RSI, or Relative Strength Index, is a powerful indicator that can provide valuable insights into market momentum. This strategy leverages RSI’s oscillations to identify potential entry and exit points in intraday trades.
In this comprehensive guide, we unpack the intricacies of the RSI Intraday Strategy, offering practical tips and techniques to optimize your trading decisions. Join us on this enlightening journey as we explore how this strategy can be a game-changer in your intraday trading endeavors.
Key Takeaways
- The RSI indicator measures the momentum and strength of a financial instrument’s price movements.
- The RSI is widely used in technical analysis for swing trading strategies.
- RSI threshold levels indicate potential overbought or oversold market conditions.
- Timing entry and exit points is crucial for maximizing profits in intraday trading.
What is RSI Intraday Strategy?
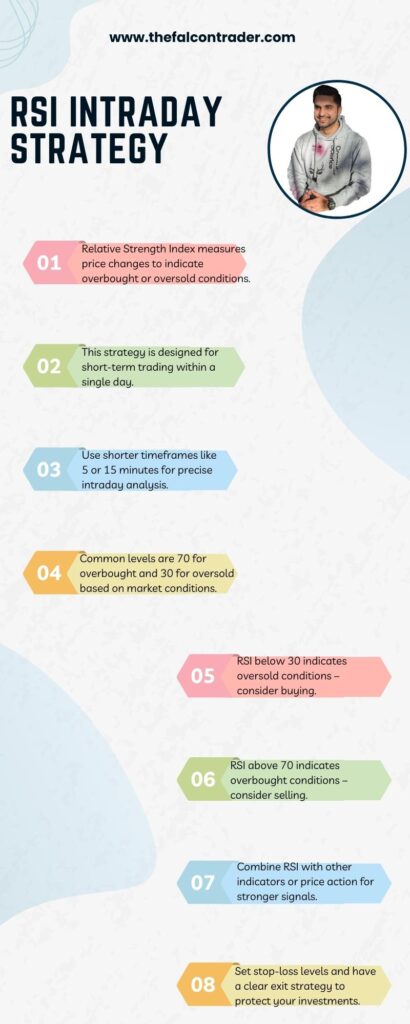
The RSI intraday strategy is a trading approach that leverages the Relative Strength Index (RSI) indicator for making decisions within a single trading day. RSI measures the speed and change of price movements, indicating overbought or oversold conditions.
In this strategy, traders monitor RSI levels to identify potential entry and exit points. When RSI crosses above a designated overbought level (usually 70), it suggests a sell signal, while crossing below an oversold level (typically 30) indicates a potential buy signal.
This intraday strategy aims to capitalize on short-term price movements based on RSI’s indications of market momentum and potential reversals.
Understanding the RSI Indicator
The RSI indicator is widely used in technical analysis to measure the momentum and strength of a financial instrument’s price movements. It stands for Relative Strength Index and was developed by J. Welles Wilder Jr. in 1978. The RSI is a popular tool among traders, particularly those engaged in swing trading strategies.
Swing trading involves taking advantage of short-term price fluctuations within a larger trend. Traders using the RSI in swing trading typically look for overbought or oversold conditions to signal potential reversals or corrections in price. When the RSI reaches above 70, it suggests that an asset may be overbought and due for a downward correction, while an RSI below 30 indicates oversold conditions and implies an upward reversal may occur.
One advantage of using the RSI in swing trading is its simplicity and ease of interpretation. Other technical indicators may require complex calculations or multiple inputs, but the RSI provides straightforward signals based on price movements alone.
When comparing the RSI with other technical indicators, it is important to consider each indicator’s strengths and weaknesses. For example, oscillators like Stochastic or MACD can also provide information about market momentum, but they may generate conflicting signals compared to the RSI due to different calculation methods or timeframes.
Setting Up the Intraday Chart
To properly set up the intraday chart, it is essential to select a suitable time frame and apply relevant technical indicators. The choice of time frame depends on the trader’s trading style and goals. Shorter time frames such as 1-minute or 5-minute charts are commonly used for intraday trading to capture smaller price movements. On the other hand, longer time frames like 15-minute or 30-minute charts can provide a broader view of market trends.
When setting up an intraday chart, traders often use technical indicators to assist in their decision-making process. Some commonly used indicators include moving averages, trend lines, and support and resistance levels. These indicators help identify key support levels where buying pressure may increase and resistance levels where selling pressure may intensify.
In addition to technical indicators, volume analysis is also crucial in intraday trading setups. Volume provides insights into the strength behind price movements and can confirm or refute signals generated by other indicators. By analyzing volume patterns alongside price action, traders can gain a better understanding of market dynamics.
To summarize, when setting up an intraday chart, selecting an appropriate time frame is important, along with applying relevant technical indicators such as moving averages and trend lines. Identifying key support levels through these indicators helps traders determine potential entry points for buying positions. Additionally, using volume analysis enhances the accuracy of trading decisions by providing insights into market strength and confirming signals from other indicators.
Identifying Overbought and Oversold Conditions
This discussion will focus on three key points related to identifying overbought and oversold conditions in trading:
- RSI threshold levels: RSI threshold levels refer to specific values of the Relative Strength Index (RSI), which are used as indicators of potential overbought or oversold market conditions.
- Timing entry and exit: Timing entry and exit involves determining the optimal moments to enter or exit a trade based on RSI signals.
- Trading against the trend: Lastly, trading against the trend refers to a strategy where traders take positions that go against the prevailing market direction indicated by RSI readings.
RSI Threshold Levels
RSI threshold levels provide a framework for determining potential overbought or oversold market conditions. These levels can be used to set up the intraday chart and help traders identify optimal entry and exit points.
Here are three important aspects of RSI threshold levels:
- Determining Overbought and Oversold Levels: RSI threshold levels typically range from 0 to 100, with values above 70 indicating overbought conditions and values below 30 suggesting oversold conditions.
- Confirmation of Price Movements: When price movements coincide with RSI readings above the overbought level, it may signal a potential reversal or correction in the market. Conversely, when price movements align with RSI readings below the oversold level, it may indicate a possible upward movement.
- Adjustment for Market Volatility: Traders should consider adjusting RSI threshold levels based on market volatility. In highly volatile markets, lower thresholds may be more appropriate to avoid false signals.
Understanding these aspects of RSI threshold levels can assist traders in identifying potential trading opportunities and timing their entry and exit points effectively.
Timing Entry and Exit
Timing entry and exit points in trading is crucial for achieving optimal results and maximizing profits. Traders often use various techniques to determine the ideal timing for entering and exiting trades.
One such technique is the trailing stop, which allows traders to protect their profits by adjusting the stop loss level as the price moves in their favor. This strategy ensures that profits are locked in while still allowing room for potential gains.
Additionally, setting profit targets can help traders identify when to exit a trade based on predetermined levels of expected profitability.
Trading Against the Trend
Trading against the trend can be a risky strategy as it involves taking positions that go against the prevailing market direction. However, for traders who are willing to take on higher risks, this strategy can potentially yield substantial profits. When considering trading against the trend, it is important to conduct thorough trend analysis and consider various factors such as market sentiment, economic indicators, and news events that may influence price movements.
Here are three key points to keep in mind when trading against the trend:
- Understand the current market conditions: Analyze whether the market is in an uptrend or downtrend by examining price patterns, moving averages, and other technical indicators.
- Identify potential turning points: Look for signs of exhaustion in the prevailing trend such as overbought or oversold conditions indicated by oscillators like RSI (Relative Strength Index).
- Use appropriate risk management techniques: Set tight stop-loss orders to limit potential losses if the trade goes against you.
By carefully considering these factors and implementing effective risk management strategies, traders can potentially profit from trading against the prevailing trend while minimizing their exposure to downside risks.
This discussion on trading against the trend provides insights into one aspect of developing effective trading strategies. The next section will delve into establishing entry and exit points within a given trade setup.
Establishing Entry and Exit Points
One important aspect in the development of an intraday strategy is the identification and determination of optimal entry and exit points for trades. Establishing profit targets and using trailing stops are two common techniques used by traders to achieve this goal.
Establishing profit targets involves setting predetermined price levels at which a trader plans to sell their position, thus locking in a certain amount of profit. This technique helps traders avoid greed-driven decision-making and ensures that they secure profits before market conditions change. By defining profit targets, traders can adhere to a disciplined approach and minimize emotional biases.
On the other hand, trailing stops are a dynamic method used to protect profits while allowing potential gains to continue. A trailing stop is initially set at a specific percentage or dollar amount below the current market price. As the trade progresses favorably, the stop loss level automatically adjusts upwards, maintaining a fixed distance from the highest achieved price. If the market reverses, however, the stop loss will remain unchanged or move downwards accordingly.
Both establishing profit targets and using trailing stops contribute to effective risk management within an intraday strategy. These methods help traders maximize profitability while minimizing potential losses by providing clear guidelines for exiting trades based on predetermined criteria rather than emotional reactions or guesswork.
Implementing Risk Management Techniques
Implementing risk management techniques is crucial in intraday trading to protect against potential losses and ensure the overall profitability of trades. Intraday trading involves high levels of volatility and market fluctuations, which can expose traders to significant risks.
To effectively manage these risks, traders employ various risk mitigation techniques:
- Diversification: Spreading investments across different securities or sectors helps reduce the impact of a single adverse event on the portfolio. By diversifying, traders can minimize their exposure to any particular asset or market.
- Stop-loss orders: Setting predetermined price levels at which trades will be automatically closed helps limit potential losses. Stop-loss orders enable traders to exit positions before losses become substantial, ensuring that they do not exceed their risk tolerance.
- Position sizing: Carefully determining the appropriate size of each trade based on risk tolerance and account balance is essential for managing risk. By allocating a specific percentage of capital per trade, traders can control their overall exposure and prevent excessive losses.
These risk management techniques are crucial for successful intraday trading as they provide a structured approach to managing potential downsides. By incorporating these strategies into their trading plans, individuals can enhance their chances of achieving long-term profitability while minimizing the negative impact of unforeseen events or market volatility.
Using RSI Divergence for Confirmation
RSI divergence refers to a discrepancy between price movement and the Relative Strength Index (RSI). By understanding this phenomenon, traders can gain insights into potential trend reversals or continuations.
The benefits of using RSI as an indicator include its ability to identify overbought and oversold conditions and provide early warning signals for potential market reversals.
Additionally, traders can use confirmation signals in conjunction with RSI divergence to strengthen their trading decisions and increase their chances of successful trades.
Overall, this discussion aims to provide a comprehensive understanding of RSI divergence, highlight its benefits, and discuss how it can be effectively used by traders.
RSI Divergence Explained
RSI divergence is a concept that can be explained in terms of the relative strength index and its relationship to price movements. The relative strength index (RSI) is a popular technical indicator used by traders to identify overbought or oversold conditions in the market. RSI divergence occurs when there is a disagreement between the RSI indicator and the price movement of an asset. This can signal potential trend reversals or continuation patterns.
Key points about RSI divergence include:
- Bullish Divergence: Occurs when the RSI makes higher lows while price makes lower lows.
- Bearish Divergence: Occurs when the RSI makes lower highs while price makes higher highs.
- Hidden Divergence: A variation where the RSI and price move in opposite directions.
Trading strategies using RSI divergence patterns can involve entering trades based on these divergences, either as confirmation for existing trends or as reversal signals.
Understanding and utilizing RSI divergence patterns can greatly enhance trading decisions and provide valuable insights into market dynamics.
Benefits of Using RSI
One advantage of incorporating the relative strength index (RSI) into trading strategies is its ability to identify potential trend reversals or continuation patterns through the analysis of RSI divergence.
RSI divergence occurs when the price of an asset moves in one direction while the RSI indicator moves in the opposite direction, indicating a possible shift in market sentiment.
This can be valuable information for traders as it provides early signals of potential trend changes, allowing them to adjust their positions accordingly.
Furthermore, using RSI can help traders filter out false signals and improve their overall trading accuracy.
By understanding and utilizing RSI effectively, traders can take advantage of its benefits such as increased profitability and reduced risk exposure.
Overall, incorporating RSI into trading strategies offers various advantages for traders seeking to make informed decisions and achieve consistent profits in the financial markets.
Confirmation Signals for Traders
Confirmation signals play a crucial role in the RSI intraday strategy as they provide traders with additional information to support their trading decisions. These signals help traders identify potential trend reversals and validate the strength of a given trend.
When using the RSI indicator, there are several confirmation signals that traders should consider:
- Divergence: This occurs when the price movement and RSI direction diverge, indicating a potential trend reversal.
- Overbought/Oversold levels: When the RSI exceeds certain threshold values (usually 70 for overbought and 30 for oversold), it suggests that the market may be due for a reversal.
- Bullish/Bearish divergences: These occur when the price makes higher highs or lower lows while the RSI fails to do so, indicating a weakening trend.
By incorporating these confirmation signals into their analysis, traders can enhance their decision-making process and increase their chances of making profitable trades.
Transitioning into the subsequent section about applying the RSI intraday strategy to different timeframes will further explore its versatility in various trading scenarios.
Applying the RSI Intraday Strategy to Different Timeframes
When applying the RSI intraday strategy to different timeframes, it is important to consider how varying periods may affect the accuracy and reliability of the signals generated. Traders often use other technical indicators in conjunction with the RSI intraday strategy to enhance their trading decisions. By combining multiple indicators, traders can gain a more comprehensive understanding of market trends and potential entry or exit points. Some commonly used indicators alongside the RSI include moving averages, MACD, Bollinger Bands, and volume analysis.
Backtesting is another crucial step in evaluating the effectiveness of the RSI intraday strategy across different timeframes. By using historical data to simulate trades based on predetermined rules, traders can assess how well the strategy would have performed in past market conditions. This process helps traders identify any weaknesses or limitations and refine their approach accordingly.
Here is a 2 column by 5 row table providing an overview of some technical indicators that can be used in combination with the RSI intraday strategy:
| Indicator | Description |
|---|---|
| Moving Averages | Smooths out price data to identify trends |
| MACD | Measures trend strength and momentum |
| Bollinger Bands | Indicates overbought/oversold conditions |
| Volume Analysis | Examines trading volume for confirmation signals |
| Fibonacci Retracement | Identifies potential support/resistance levels based on key ratios |
Fine-tuning and Optimizing the RSI Intraday Strategy
To fine-tune and optimize the RSI intraday strategy, traders can explore various parameters such as the length of the RSI period, overbought and oversold levels, and the timeframes used for analysis. By adjusting these parameters based on backtesting results, traders can improve the effectiveness of their strategy.
Length of the RSI period:
- Shorter periods (e.g., 6 or 9) may provide more timely signals but could be prone to false positives.
- Longer periods (e.g., 14 or 21) may generate more reliable signals but could result in delayed entries or exits.
Overbought and oversold levels:
- Lowering the overbought level (e.g., from 70 to 65) may reduce false sell signals.
- Increasing the oversold level (e.g., from 30 to 35) may decrease false buy signals.
Timeframes for analysis:
- Using multiple timeframes (e.g., combining hourly and daily charts) can provide a broader perspective on market trends.
- Focusing on shorter timeframes (e.g., using minute-based charts) may help capture short-term price movements more effectively.
Optimizing these parameters is essential to adapt the RSI intraday strategy to different market conditions. However, it is crucial to remember that no strategy guarantees success. Traders should continuously monitor performance, conduct regular backtesting, and adjust parameters accordingly to stay ahead in this ever-evolving market.
Conclusion
In conclusion, the “RSI Intraday Strategy” is a potent tool for intraday traders looking to navigate the fast-paced world of financial markets. By harnessing the insights provided by the RSI indicator, traders can make informed decisions to capitalize on market momentum. However, it’s crucial to combine this strategy with sound risk management and a well-defined trading plan.
As you embark on your intraday trading journey, let this guide be your trusted companion, offering valuable insights and empowering you to make calculated moves in the markets. With the RSI Intraday Strategy, you have the potential to enhance your intraday trading performance and achieve your financial goals.
References
- Heuristic based trading system on Forex data using technical indicator rules
- Technical indicators for forex forecasting: a preliminary study
- A Forex trading expert system based on a new approach to the rule-base evidential reasoning
- FOREX Trading and Investment
Frequently Asked Questions
How Does the RSI Indicator Calculate and Interpret Overbought and Oversold Conditions?
The interpretation of RSI signals involves assessing overbought and oversold conditions. The RSI indicator calculates these conditions by measuring the magnitude and velocity of recent price movements. Different RSI period lengths can impact the identification of these conditions.
What Are Some Common Risk Management Techniques That Can Be Implemented When Using the RSI Intraday Strategy?
When implementing the RSI intraday strategy, common risk management techniques and exit strategies can be employed to mitigate potential losses. These techniques aim to control risk exposure and ensure efficient capital allocation.
Can the RSI Intraday Strategy Be Used Effectively on Longer Timeframes, Such as Daily or Weekly Charts?
The effectiveness of the RSI intraday strategy on longer timeframes, such as daily or weekly charts, and its long term applications are significant topics of inquiry among researchers in the field.
Are There Any Additional Confirmation Signals That Can Be Used in Conjunction With RSI Divergence to Increase the Accuracy of the Intraday Strategy?
The inclusion of additional confirmation signals in conjunction with RSI divergence has the potential to enhance the accuracy of intraday strategies. Such signals can provide further validation and reliability to the trading decisions made based on RSI analysis.
What Are Some Key Factors to Consider When Fine-Tuning and Optimizing the RSI Intraday Strategy for Specific Trading Preferences or Market Conditions?
When fine-tuning and optimizing a trading strategy, key factors to consider include employing various fine tuning techniques and making adjustments based on market conditions. These factors contribute to the customization of the strategy to specific trading preferences and market conditions.


