

Embark on a captivating journey into the world of trading with our guide on “Understanding Support and Resistance.” Delving into the intricacies of market dynamics, support and resistance are the cornerstones of technical analysis. These vital concepts empower traders to decipher price movements, identify trends, and make informed decisions.
In this comprehensive exploration, we demystify the significance of support and resistance levels, offering insights into their interpretation and application. Join us as we unravel the mysteries of these essential trading tools and equip you with the knowledge to navigate the ever-changing landscape of financial markets.
Key Takeaways
- Proper risk management techniques are crucial when trading support and resistance levels to limit potential losses and protect capital.
- Psychological factors such as greed and fear can impact decision making, so traders must remain disciplined and avoid emotional decision-making.
- Relying solely on historical support or resistance levels may not be reliable, and it’s important to consider other indicators and current market conditions.
- Advanced techniques like trendline analysis, Fibonacci retracements, and moving averages provide valuable insights into market dynamics and help traders make more informed decisions.
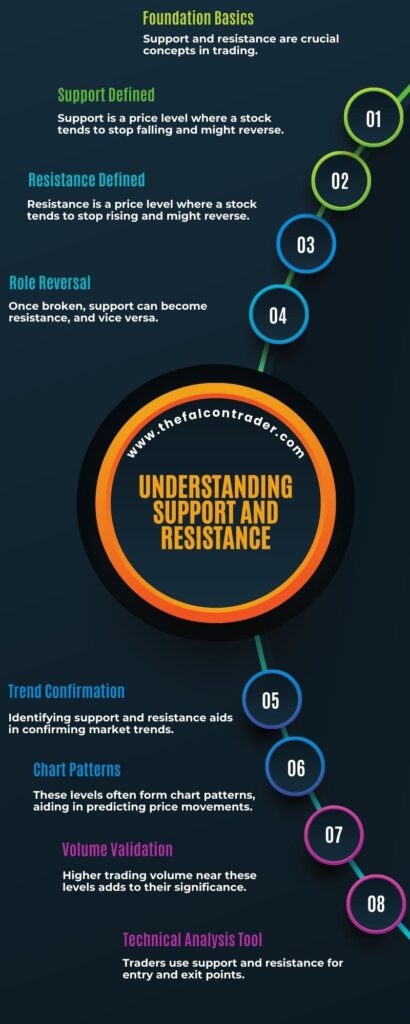
Understanding Support And Resistance
Support and resistance levels are defined as price points on a chart where the buying pressure (support) or selling pressure (resistance) is significant enough to prevent the price from rising further or declining further, respectively. These levels are crucial in technical analysis as they help traders identify key levels where the market may reverse its direction.
By interpreting price action around these levels, traders can make informed decisions about their trading strategies.
To identify support and resistance levels on a chart, traders analyze historical price data and look for areas where the price has previously reversed or stalled. These areas often correspond to previous highs or lows, trendlines, moving averages, or Fibonacci retracement levels. Traders also pay attention to volume and patterns such as double tops or bottoms that suggest strong buying or selling pressure at specific price points.
Understanding support and resistance levels is essential for both short-term and long-term trading strategies. They provide valuable information about potential entry and exit points, allowing traders to manage risk effectively. Additionally, these levels can act as psychological barriers where market participants tend to buy or sell assets.
In the next section, we will explore different methods for identifying support and resistance levels on a chart without relying solely on historical data.
Identifying Support and Resistance Levels on a Chart
On a chart, levels that act as barriers to price movement can be identified through the analysis of historical data. These levels, often compared to roadblocks on a journey, can provide insights into potential areas where buying or selling pressure may emerge.
One common method for identifying support and resistance levels is by drawing trendlines. Trendlines are lines drawn on a chart that connect consecutive highs or lows in price action. When a trendline is drawn connecting consecutive lows, it represents a support level. Conversely, when a trendline connects consecutive highs, it represents a resistance level.
Another way to identify support and resistance levels is by interpreting candlestick patterns. Candlestick patterns are graphical representations of price action over a specific period of time. Certain candlestick patterns can indicate the presence of support or resistance levels. For example, long wicks at the bottom of candlesticks may suggest strong buying pressure at that level, indicating support. On the other hand, long wicks at the top of candlesticks may indicate strong selling pressure at that level, suggesting resistance.
Understanding how to identify these support and resistance levels is crucial in technical analysis as they provide important information about potential future price movements. By recognizing these key levels on a chart, traders and investors can make more informed decisions regarding their entry and exit points in the market.

Moving forward into the next section about the importance of support and resistance in technical analysis…
Importance of Support and Resistance in Technical Analysis
The significance of identifying and analyzing support and resistance levels lies in their ability to provide valuable insights into potential price movements. By drawing trendlines connecting consecutive lows or highs, market participants can visualize the direction in which prices are trending. This information can be used to determine whether an asset is experiencing an uptrend or a downtrend, providing guidance for trading strategies.
Another important factor to consider when analyzing support and resistance levels is the role of volume. High trading volumes at specific price levels indicate strong buying or selling pressure, suggesting that these levels are significant in terms of support or resistance. Conversely, low trading volumes may indicate weak support or resistance.
In summary, understanding the importance of trendlines in technical analysis and considering the role of volume in support and resistance can assist traders and investors in making well-informed decisions. These insights allow for a better understanding of potential price movements, aiding in determining entry and exit points while minimizing risks.
Transitioning into the subsequent section about ‘using support and resistance to determine entry and exit points,’ this analysis provides a solid foundation for effective decision-making processes.
Using Support and Resistance to Determine Entry and Exit Points
By analyzing the historical data and graphical representations of price action, market participants can strategically utilize identified areas of strong buying or selling pressure in order to determine optimal entry and exit points for their trades. Support and resistance levels play a crucial role in this process as they provide important reference points for traders. Determining price targets becomes easier when support and resistance levels are effectively used.
Support levels represent areas where buying pressure is stronger than selling pressure, causing prices to bounce back up. Traders can use these levels to identify potential entry points for long positions with the expectation that prices will continue to rise after reaching the support level.
Conversely, resistance levels indicate areas where selling pressure outweighs buying pressure, leading to a potential reversal in price direction. Traders can use these levels to identify potential exit points for long positions or entry points for short positions.
Trendlines also play a vital role in determining entry and exit points. By drawing trendlines connecting consecutive higher lows or lower highs, traders can identify the overall direction of the trend and make more informed trading decisions based on it.
In conclusion, understanding support and resistance levels allows traders to determine optimal entry and exit points by analyzing historical data patterns and using trendlines effectively. This knowledge forms the basis for developing effective trading strategies that capitalize on these key market dynamics without relying on arbitrary steps.
If interested you can read about long and short position in Forex here. Moreover, you can read about currency pairs here.
Strategies for Trading Support and Resistance Levels
Strategies aimed at effectively trading support and resistance levels can significantly enhance traders’ ability to capitalize on market dynamics and generate favorable outcomes. By understanding the psychology behind support and resistance levels, traders can make informed decisions based on market sentiment. Additionally, implementing proper risk management techniques can help minimize losses and maximize profits.
- Emphasize patience: Trading support and resistance levels requires a patient approach, as these levels may take time to develop or break. Traders need to wait for confirmation before entering or exiting a trade.
- Utilize price action analysis: Analyzing price movements around support and resistance levels can provide valuable insights into market trends. Traders should look for patterns such as breakouts or reversals that indicate potential trading opportunities.
- Set realistic profit targets: Traders should set achievable profit targets based on the strength of the support or resistance level. Setting overly ambitious targets may lead to missed opportunities or premature exits.
- Implement strict stop-loss orders: Having predefined stop-loss orders in place helps limit potential losses when a trade goes against expectations. This risk management technique ensures that traders exit positions before significant losses occur.
By incorporating these strategies into their trading approach, individuals can increase their chances of success when dealing with support and resistance levels.
However, it is important to be aware of common mistakes that traders often make when engaging in these types of trades without proper knowledge or experience in order to achieve consistent profitability.
Common Mistakes to Avoid When Trading Support and Resistance
One common mistake traders often make when dealing with support and resistance levels is underestimating the importance of proper risk management techniques, which can lead to significant losses and missed trading opportunities. While identifying support and resistance levels is crucial for successful trading, it is equally important to have a robust risk management plan in place. Traders should always set stop-loss orders to limit potential losses and protect their capital. Failing to do so can result in substantial financial setbacks.
Additionally, psychological factors play a significant role in decision making when trading support and resistance levels. Greed and fear can cloud judgment and lead to impulsive actions that deviate from a well-thought-out strategy. Traders must remain disciplined, stick to their predetermined entry and exit points, and avoid emotional decision-making.
Another pitfall is overreliance on historical support or resistance levels without considering current market conditions. Market dynamics constantly change, and relying solely on past data may not be effective. It is essential to analyze other indicators such as volume, trends, and market sentiment to validate the significance of support or resistance levels.
In conclusion, traders must prioritize proper risk management techniques while trading support and resistance levels. They should also be aware of the psychological factors influencing decision making in this context. By avoiding common pitfalls like neglecting risk management or being driven by emotions, traders can enhance their success rate when dealing with support and resistance levels.
Moving forward into advanced techniques for analyzing support and resistance levels.
Advanced Techniques for Analyzing Support and Resistance Levels
An in-depth examination of support and resistance levels can reveal additional layers of market analysis that go beyond basic identification. These advanced techniques provide traders with a more comprehensive understanding of price action and help to identify potential areas of support or resistance with greater precision.
- Trendline analysis: By drawing trendlines connecting the highs or lows on a price chart, traders can identify the direction and strength of a trend. This technique helps to determine key levels of support and resistance within the overall trend.
- Fibonacci retracements: Based on the mathematical sequence discovered by Leonardo Fibonacci, this technique involves drawing horizontal lines at specific percentages (such as 38.2%, 50%, or 61.8%) between major swing points on a price chart. These levels often act as significant areas of support or resistance.
- Moving averages: Moving averages are used to smooth out price data over a specified period of time, helping traders identify trends and potential support/resistance levels based on average prices over different time frames.
By incorporating these advanced techniques into their analysis, traders can gain valuable insights into market dynamics and make more informed trading decisions based on objective data-driven analysis.
Conclusion
In conclusion, “Understanding Support and Resistance” serves as a compass for traders navigating the complexities of market analysis. Recognizing these critical levels provides valuable insights into potential price reversals and trend continuation. By grasping the dynamics of support and resistance, traders gain the upper hand in predicting market movements and making strategic trading decisions. As you venture into the world of trading, let this guide be your beacon, reminding you of the power these concepts hold in unraveling market behavior. Embrace the art of understanding support and resistance, and let it guide your journey towards becoming a more proficient and successful trader.
References
- Forex trading and the WMR fix
- Reinforcement learning applied to Forex trading
- A Forex trading system based on a genetic algorithm
- A Forex trading expert system based on a new approach to the rule-base evidential reasoning
Frequently Asked Questions
How do support and resistance levels differ in different financial markets?
Support and resistance levels are vital in both forex trading and stock market analysis. In forex, they help identify key price levels where buying or selling pressure may emerge. In stocks, these levels indicate areas of potential reversal or continuation of trends.
Can support and resistance levels be used for short-term trading strategies?
Using support and resistance levels for intraday trading can be beneficial in identifying potential entry and exit points. However, relying solely on these levels for short-term trades has limitations, such as false breakouts and the inability to capture larger market trends.
Are support and resistance levels more reliable in trending or range-bound markets?
Support and resistance levels can be more reliable in trending markets as there is a clear direction. Volume plays a role in identifying these levels, as higher volume suggests stronger support or resistance. News events can also impact these levels, causing them to break or hold.
How can support and resistance levels be used in conjunction with other technical indicators?
Combining support and resistance with moving averages allows traders to identify potential buy or sell signals. Additionally, using support and resistance levels in conjunction with volume analysis can provide confirmation of market trends, enhancing the reliability of trading decisions.
Is it possible to accurately predict when support or resistance levels will be broken?
Accurately predicting support and resistance breakouts is challenging due to the impact of market volatility on these levels. The unpredictable nature of markets makes it difficult to determine when these levels will be breached with certainty.


