

Delve into the dynamic world of Forex trading as we demystify “What Are Indicators and Oscillators.” In the ever-evolving landscape of currency markets, these tools are your compass, guiding you towards informed trading decisions.
Indicators and oscillators offer valuable insights into market trends, momentum, and potential reversals, empowering traders to navigate the complexities of Forex with precision. Join us on this illuminating journey as we explore how these powerful instruments can amplify your trading strategies, refine your entries and exits, and ultimately contribute to your success in the world of Forex trading.
Key Takeaways
- Indicators and oscillators are mathematical calculations used in technical analysis to identify patterns and trends in financial markets.
- Commonly used indicators include the Relative Strength Index (RSI), Moving Average Convergence Divergence (MACD), Stochastic Oscillator, and Bollinger Bands.
- Indicators and oscillators help traders make informed decisions, identify entry or exit points, and confirm signals from other technical analysis tools.
- It is important to choose the right oscillator based on responsiveness, accuracy, and the trader’s strategy, and to consider the limitations of indicators and the need for additional analysis.
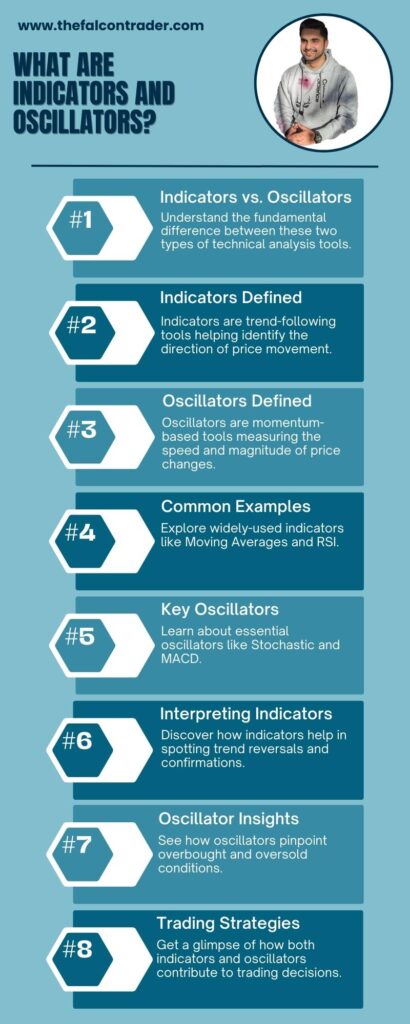
What Are Indicators and Oscillators?
Indicators and oscillators in forex trading are tools used to analyze price movements and predict future market trends. Indicators are mathematical calculations applied to a currency pair’s price, volume, or open interest data. They help traders identify potential buy or sell signals based on historical price patterns and trends.
Oscillators, on the other hand, are a specific type of indicator. They typically move within a fixed range, helping traders identify overbought or oversold conditions in the market. Popular oscillators include the Relative Strength Index (RSI) and the Moving Average Convergence Divergence (MACD).
In essence, both indicators and oscillators provide valuable insights into market dynamics, aiding traders in making informed decisions about their forex positions.
Understanding Technical Analysis
Understanding technical analysis involves studying various indicators and oscillators to identify patterns and trends in financial markets. Technical analysis is a method used by traders to forecast future price movements based on historical market data. It relies on the premise that past price and volume data can provide insights into future market behavior. Traders use a wide range of analysis techniques, including chart patterns, trend lines, support and resistance levels, moving averages, and momentum indicators.
Indicators are mathematical calculations applied to price or volume data to help identify potential trading opportunities. Commonly used indicators include the Relative Strength Index (RSI), Moving Average Convergence Divergence (MACD), Stochastic Oscillator, and Bollinger Bands. These indicators provide traders with information about overbought or oversold conditions, trend strength, and potential reversal points.
Oscillators are a type of indicator that fluctuates between two extreme values to indicate overbought or oversold conditions. They can be useful for identifying potential turning points in the market. Examples of popular oscillators include the RSI, MACD histogram, and Commodity Channel Index (CCI).
The benefits of technical analysis lie in its ability to help traders make informed decisions based on objective data rather than relying solely on emotions or opinions. By using analysis techniques such as indicators and oscillators, traders can gain insights into market trends, volatility levels, and potential entry or exit points for trades. This knowledge can improve their chances of making profitable trades while managing risk effectively.
Types of Indicators
Categorizing these tools can be done based on their mathematical calculations and the type of information they provide to traders. Indicators and oscillators are commonly used in forex trading to analyze price movements and identify potential trends. They help traders make informed decisions by providing insights into market dynamics.
Some types of indicators include:
- Moving Averages: These indicators smooth out price data over a specified period, helping traders identify trends and potential reversal points.
- Bollinger Bands: These indicators consist of a moving average with an upper and lower band that represent the standard deviation from the average. They are used to identify overbought or oversold conditions.
- Relative Strength Index (RSI): This momentum indicator measures the speed and change of price movements. It is often used to determine if a currency pair is overbought or oversold.
- Stochastic Oscillator: This indicator compares a closing price to its price range over a given time period, indicating potential trend reversals.
- MACD (Moving Average Convergence Divergence): This indicator calculates the difference between two moving averages, signaling potential buy or sell opportunities.
Popular Oscillators
This discussion will focus on comparing and contrasting the Relative Strength Index (RSI) with the Stochastic oscillator.
These popular oscillators are commonly used by traders to analyze market trends and identify potential entry or exit points.
By understanding their unique characteristics and how they generate signals, traders can make informed decisions based on technical analysis.
In addition to the RSI and Stochastic oscillator, we will also examine the Moving Average Convergence Divergence (MACD) and Bollinger Bands.
These indicators provide valuable insights into market momentum and volatility.
RSI Vs. Stochastic
The Relative Strength Index (RSI) and Stochastic oscillator are two commonly used technical indicators in Forex trading that provide insights into potential overbought or oversold conditions in a market. Both indicators aim to identify price levels at which an asset may be due for a reversal or correction. While they serve similar purposes, there are some key differences between RSI and Stochastic:
- RSI is a momentum oscillator that measures the speed and change of price movements, indicating whether an asset is overbought or oversold.
- Stochastic oscillator compares the closing price of an asset to its price range over a specified period, identifying potential turning points.
Comparing overbought and oversold conditions:
- RSI uses divergence analysis to identify potential reversals.
- Stochastic identifies overbought and oversold conditions by comparing the current closing price with the highest high or lowest low within a given timeframe.
Overall, both RSI and Stochastic can be valuable tools for traders to assess market conditions, but their methodologies differ slightly in how they analyze overbought and oversold conditions.
MACD and Bollinger Bands
MACD and Bollinger Bands are technical analysis tools commonly used by traders to identify potential trends, reversals, and volatility in financial markets.
The Moving Average Convergence Divergence (MACD) is based on the concept of moving averages and consists of two lines: the MACD line and the signal line. Traders analyze the crossovers between these lines to determine buy or sell signals. The MACD can also be used to identify divergence between price and momentum, which may suggest a potential trend reversal.
On the other hand, Bollinger Bands consist of an upper band, a lower band, and a middle band based on a moving average. Traders use Bollinger Bands to assess market volatility and identify potential overbought or oversold conditions. By analyzing price movements within the bands, traders can make informed decisions regarding trend analysis.
Overall, both MACD and Bollinger Bands provide valuable insights into market trends and help traders make informed trading decisions.
How Indicators and Oscillators Work
Indicators and oscillators in forex trading operate by utilizing mathematical formulas to analyze historical price data and generate signals for potential market trends. These tools have become an integral part of technical analysis, aiding traders in making informed decisions.
Benefits of using indicators and oscillators include:
- Identifying market trends: Indicators can help detect the overall direction of the market, whether it’s trending up, down, or sideways.
- Generating entry and exit signals: By analyzing price movements, indicators can provide signals for entering or exiting trades at opportune moments.
- Confirming price patterns: Indicators can validate chart patterns such as support and resistance levels, trendlines, and breakouts.
- Assessing momentum: Oscillators measure the speed and strength of price movements, indicating overbought or oversold conditions.
- Improving risk management: Indicators can assist in setting stop-loss levels or determining optimal profit targets.
However, relying solely on indicators and oscillators has its limitations:
- Delayed signals: Indicators are based on historical data, which means they may not accurately predict future price movements in real-time.
- False signals: Market conditions can change rapidly, leading to false trade signals generated by indicators that fail to adapt quickly enough.
- Lack of context: Indicators alone may not consider fundamental factors influencing markets, so additional analysis is necessary for a comprehensive understanding.
To maximize the benefits while mitigating limitations, traders often combine multiple indicators with other analytical techniques to form a well-rounded trading strategy.
If interested you can read about candlestick charts here. Moreover, you can read more about technical analysis here.
Using Indicators and Oscillators in Forex Trading
The use of indicators and oscillators is crucial in forex trading as they provide valuable insights into market trends and help traders make informed decisions.
Choosing the right oscillator is essential for accurate analysis, as different oscillators have varying characteristics and are suitable for different trading strategies.
Interpreting indicator signals requires a thorough understanding of their components, such as moving averages or price momentum, to accurately gauge market conditions and potential entry or exit points.
Importance of Indicators
One aspect to consider is the significance of utilizing indicators in forex trading. Indicators play an important role in analyzing market trends and making informed trading decisions. Interpreting indicator data can provide valuable insights into price movements, volatility, and potential entry or exit points for trades.
Here are five benefits of using indicators:
- Improved decision-making: Indicators help traders identify potential opportunities and make more informed decisions based on objective data.
- Trend identification: Indicators can assist in identifying market trends, allowing traders to align their strategies with the prevailing direction.
- Confirmation of signals: Indicators can act as a confirmation tool, validating other technical analysis tools or signals before executing a trade.
- Risk management: Indicators provide insights into market conditions and volatility, aiding in risk assessment and management.
- Strategy development: By analyzing indicator data over time, traders can develop and refine their trading strategies for better performance.
Incorporating indicators into forex trading allows for a more comprehensive analysis of the market and enhances the overall trading experience.
Choosing the Right Oscillator
When selecting an oscillator, it is crucial to consider its responsiveness and ability to capture price fluctuations accurately. The choice of the right oscillator plays a significant role in developing a successful forex trading strategy. Traders need to analyze market trends and identify suitable oscillators that align with their chosen strategies.
There are various types of oscillators available, such as the Relative Strength Index (RSI), Moving Average Convergence Divergence (MACD), and Stochastic Oscillator, among others. Each oscillator has its own strengths and weaknesses, which should be evaluated based on the trader’s specific requirements.
Interpreting Indicator Signals
To effectively interpret signals from technical analysis tools, it is essential to understand their underlying mathematical formulas and the concepts they represent. This knowledge allows traders to make informed decisions based on indicator trends and crossovers.
When interpreting indicator trends, traders should consider the direction and strength of the trend. A steep upward or downward slope indicates a strong trend, while a flat line suggests a lack of momentum.
Additionally, analyzing indicator crossovers can provide valuable insights into market conditions. A bullish crossover occurs when a shorter-term moving average crosses above a longer-term moving average, indicating potential buying opportunities. Conversely, a bearish crossover happens when a shorter-term moving average crosses below a longer-term moving average, suggesting potential selling opportunities.
Common Mistakes to Avoid
A common mistake to avoid in forex trading is relying solely on indicators and oscillators without considering other factors that may influence market movements. While indicators and oscillators are valuable tools for technical analysis, they should be used in conjunction with other forms of analysis to make informed trading decisions.
One of the most frequent mistakes made by traders is an over-reliance on indicators and oscillators without proper utilization. Traders often fall into the trap of thinking that these tools alone can accurately predict future market trends. However, it is important to remember that indicators and oscillators are based on historical price data and mathematical calculations. They provide insights into past market behavior but cannot guarantee future outcomes.
Another mistake is using too many indicators at once, leading to information overload. This can result in conflicting signals and confusion, making it difficult for traders to make effective decisions. It is crucial to select a few key indicators that align with one’s trading strategy and focus on their signals rather than becoming overwhelmed by a multitude of conflicting information.
In conclusion, while indicators and oscillators play a crucial role in forex trading, they should not be relied upon as the sole basis for decision-making. It is important for traders to consider other factors such as fundamental analysis, economic news releases, and market sentiment when interpreting indicator signals. By integrating multiple forms of analysis, traders can improve their chances of making successful trades.
Transition: Now that we have discussed some common mistakes to avoid when using indicators and oscillators in forex trading, let’s explore some best practices for effectively utilizing these tools in the next section.
Best Practices for Using Indicators and Oscillators
In order to effectively utilize these tools, it is important for traders to carefully select a few key indicators or oscillators that align with their trading strategy and focus on the signals provided by these selected tools. By following some best practices for indicator selection, traders can improve their decision-making process and avoid common pitfalls in using indicators and oscillators.
Some best practices for indicator selection include:
- Understanding the purpose: Traders should have a clear understanding of the purpose of each indicator or oscillator they choose. This includes knowing whether it is a trend-following or trend-reversal indicator, its calculation method, and any limitations associated with its use.
- Analyzing historical performance: It is crucial to analyze the historical performance of indicators and oscillators before incorporating them into a trading strategy. This helps traders assess their effectiveness in different market conditions.
- Considering correlation: Traders should consider the correlation between different indicators and oscillators when selecting them. Using multiple tools that provide similar signals may not necessarily improve accuracy but can introduce redundancy.
- Testing on demo accounts: Before using indicators and oscillators on live accounts, it is advisable to test them thoroughly on demo accounts. This allows traders to gain familiarity with the tools without risking real funds.
- Regular evaluation: Traders should regularly evaluate the performance of selected indicators and oscillators to ensure they continue to align with their trading goals. Adjustments or replacements may be necessary if certain tools prove ineffective over time.
Conclusion
In conclusion, understanding “What Are Indicators and Oscillators” is pivotal for traders seeking to thrive in the Forex market. These tools, when used effectively, provide essential information on market conditions, helping traders make informed decisions.
From identifying entry and exit points to gauging trend strength and potential reversals, indicators and oscillators are invaluable allies in the trader’s toolkit. As you embark on your Forex trading journey, let this guide be your source of knowledge and inspiration, empowering you to harness the power of these tools for optimal trading outcomes. Embrace the possibilities that indicators and oscillators offer and elevate your Forex trading game to new heights.
References
- Lessons from the evolution of foreign exchange trading strategies
- Application of neural network for forecasting of exchange rates and forex trading
- Multi-agent forex trading system
- Short-term predictions in forex trading
Frequently Asked Questions
Are Indicators and Oscillators the Only Tools Used in Forex Trading?
Fundamental analysis can be used alongside indicators and oscillators in forex trading. Limitations of relying solely on indicators and oscillators include their inability to consider fundamental factors and the potential for false signals.
How Can I Choose the Most Suitable Indicators and Oscillators for My Trading Strategy?
Choosing suitable indicators and oscillators is crucial for a successful forex trading strategy. Their selection greatly impacts trading outcomes. Knowledge, analysis, and attention to detail are necessary when considering the most appropriate tools for one’s specific approach.
Can I Rely Solely on Indicators and Oscillators to Make Profitable Trades?
The reliance solely on indicators and oscillators for profitable trades in forex trading is questionable. Fundamental analysis plays a crucial role, while understanding market conditions and trends is vital to effectively utilize these tools.
Are There Any Indicators or Oscillators That Work Best for Specific Currency Pairs?
The effectiveness of indicators and oscillators in forex trading varies depending on the specific currency pairs. Certain indicators, such as those suitable for scalping, may work better for certain pairs, while oscillators may be more effective in trend trading.
How Often Should I Update My Indicators and Oscillators to Ensure Their Effectiveness in Forex Trading?
To ensure the effectiveness of indicators and oscillators in forex trading, determining the best time frame to update them is crucial. Additionally, optimizing their settings for maximum effectiveness can enhance trading outcomes.


