

Embark on a journey into the world of technical analysis with our guide on “How to Trade Wedge and Triangle Chart Patterns.” These patterns are powerful indicators that can unlock opportunities in the financial markets. A wedge signifies a potential trend reversal or continuation, while a triangle hints at an impending breakout.
Understanding the nuances of these patterns is key to making informed trading decisions. In this comprehensive guide, we delve into the intricacies, offering practical insights and strategies. Join us as we equip you with the knowledge to confidently identify and trade these patterns, enhancing your proficiency in the dynamic realm of chart analysis.
Key Takeaways
- Wedge and triangle patterns are commonly seen in the forex market.
- Proper analysis of these patterns involves understanding trend lines, support/resistance levels, and volume.
- Position sizing and money management are crucial elements in trading these patterns.
- Accurate identification of patterns is essential before entering a trade, and using risk management techniques can minimize potential losses.
Identifying Wedge and Triangle Chart Patterns
Identification of wedge and triangle chart patterns is a key factor in successful forex trading. As such, it is important for traders to develop an understanding of the various formations that can arise on a price chart.
Wedge and triangle patterns are two common formations that are regularly seen in the forex market, and they can be used as part of scalping strategies or longer-term risk management approaches. The wedge pattern is typically characterized by converging trendlines with both lines rising or falling at roughly equal angles.
Triangle patterns have three distinct points: a peak, followed by two troughs either side of the peak before another peak forms. This creates a ‘triangle’ shape on the price chart.
Knowing how to recognize these chart patterns is critical when it comes to making profitable trades in the forex market. In order to effectively analyze wedge and triangle chart patterns, traders must understand how to interpret their respective implications for price action.
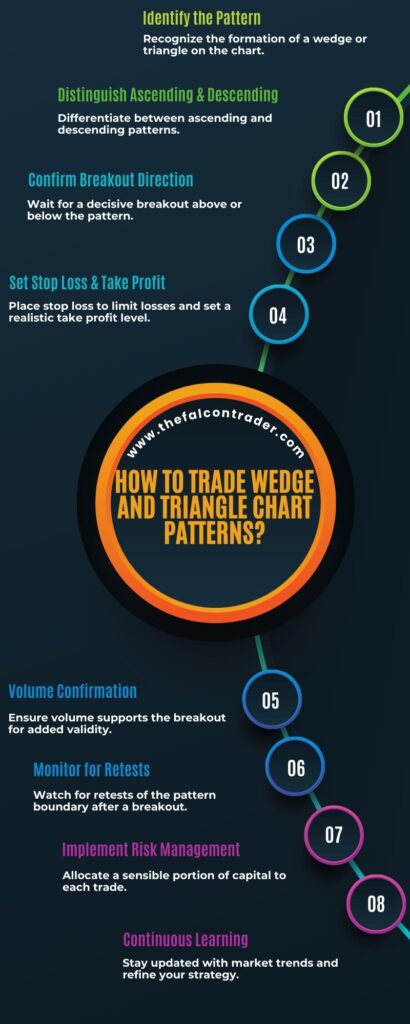
How To Trade Wedge And Triangle Chart Patterns?
| Step | Description |
| 1. Identifying Patterns | Wedge Patterns: Rising and Falling Wedges indicate potential trend reversals or continuations. Triangle Patterns: Ascending, Descending, and Symmetrical Triangles signal impending breakouts. |
| 2. Confirming with Indicators | Use volume and momentum indicators to validate the pattern. Higher volume during a breakout strengthens the signal. |
| 3. Setting Entry and Exit Points | Entry Point: Trade is executed after the price breaks out of the pattern. Above upper trendline for bullish, below lower trendline for bearish. Stop Loss and Take Profit: Determine based on historical support/resistance or Fibonacci extensions. |
| 4. Risk Management and Position Sizing | Allocate a small percentage (e.g., 1-2%) of total capital to a single trade. Determine position size based on the distance between entry and stop-loss levels. |
| 5. Monitoring the Trade | Keep a close watch on the position. Adjust stop-loss levels to lock in profits or limit potential losses. |
| 6. Adapting to Market Conditions | Be flexible and ready to adjust strategies based on changing market conditions. |
| 7. Continuous Learning and Practice | Regular practice, staying updated with market trends, and continuous learning are essential for refining trading strategies. |
Analyzing Wedge and Triangle Chart Patterns
Analyzing wedge and triangle chart patterns can be a complex task. Identifying these patterns requires a trader to have an understanding of the various characteristics that make up these formations, including trend lines, support/resistance levels, and volume.
Once identified, traders must then develop trading strategies to capitalize on these patterns. It is important for traders to understand how different types of wedges and triangles behave in order to properly craft their trading plan.
Identifying Patterns
Distinguishing wedge and triangle chart patterns requires careful consideration of their unique characteristics. Market timing is a key factor in chart reading, as both triangles and wedges can be classified as either continuation or reversal patterns depending on the direction of the trend prior to the formation.
Triangle patterns are characterized by converging trendlines that form an apex at some point in time, while wedges feature two diverging trendlines that slope towards each other. Each type has its own set of rules for identifying them correctly; for instance, rising wedges may indicate a bearish reversal whereas falling wedges could signal a bullish reversal.
With this knowledge in hand, traders can move onto the next step of analyzing their potential trading strategies.
Trading Strategies
Once traders have identified and distinguished the characteristics of wedge and triangle chart patterns, they can begin to analyze possible trading strategies. It is important to keep in mind that position sizing and money management are key elements when trading these chart patterns.
Traders must assess their risk tolerance, determine how much capital they are willing to allocate for each trade, set stop losses, and other key parameters before entering a trade. Setting appropriate take profit levels is critical for capturing the maximum reward potential of any given pattern.
Additionally, traders should consider exits based on technical indicators such as moving averages or support/resistance levels. These strategies can help maximize profits while managing risk exposure. By utilizing proper position sizing and money management techniques, traders can enhance their chances for success when trading wedge and triangle chart patterns.
With this knowledge in hand, the next step is understanding how to enter and exit these trades with precision.
Entering and Exiting Wedge and Triangle Chart Patterns
When trading wedge and triangle chart patterns in forex, two key considerations are identifying the pattern correctly and setting appropriate target prices, stop orders, and limits.
It is essential to accurately identify a wedge or triangle pattern before entering a trade as incorrect identification can lead to losses.
Once the pattern has been identified, traders should set targets, stops and limits accordingly in order to maximize potential profits and limit risks.
Identifying Patterns
It is important to accurately identify wedge and triangle chart patterns in forex trading. Swing Traders must study the charts for visual cues that will inform their market timing decisions.
The wedge pattern can be identified by a narrowing of price action, with a downward slope during bearish conditions or an upward slope during bullish conditions.
Triangle patterns are characterized by converging trendlines as prices move towards the apex of the triangle. To identify these patterns correctly, it is important to note the angle of each trendline and observe whether there is an increase or decrease in trading volume as prices approach the apex.
Setting Targets
Examining trends in price action can provide insight into potential entry and exit points for trades. Setting targets is a key part of managing risk when trading wedge and triangle chart patterns in Forex:
- Utilize stop-loss orders to protect against unexpected market movements.
- Take profits at predetermined levels to maximize returns on successful trades.
- Be mindful of the underlying trend when setting targets—it’s important to stay aligned with it.
- Use sound money management practices, like limiting your exposure to any one trade or currency pair, to ensure you don’t overextend yourself financially.
Stops & Limits
Using proper risk management techniques, such as setting stops and limits, can help traders to limit their exposure to unexpected market movements. Stop losses are a useful tool for managing risk in Forex trading when using wedge and triangle chart patterns. A stop loss order will automatically close out a position if the price moves too far against the trader’s expectations.
Take profits also provide an important way to manage risk, allowing traders to lock in gains when their target is reached. Properly utilizing these tools allows traders to stay disciplined and maximize returns on their investments while limiting their losses in volatile markets. These strategies should be combined with other risk management tactics such as diversification and position sizing for maximum effectiveness.
This helps ensure that any negative outcomes can be minimized, providing peace of mind during periods of market uncertainty. Moving forward into the subsequent section about ‘risk management strategies for wedge and triangle chart patterns’, it is essential to understand how these tools work together in order to manage risk effectively.
Risk Management Strategies for Wedge and Triangle Chart Patterns
Risk management strategies are essential for successful trading of wedge and triangle chart patterns in the forex market. To help mitigate risk, traders should consider several key principles as part of their overall strategy:
- Position sizing – determine the maximum amount of capital to allocate towards each trade and stick to it.
- Money management – use stop-loss orders or trailing stops to minimize potential losses from unexpected market movements.
- Risk-reward ratio – calculate the expected return on investment (ROI) before entering a trade so that profits are greater than losses.
- Time frame – select an appropriate time frame for your trading style and adjust accordingly when needed to find optimal trades.
By following these principles, traders can protect their capital while still taking advantage of potential profits from wedge and triangle chart patterns in the forex market.
Additionally, understanding different types of risk is important for setting up effective risk management strategies that fit individual trading goals and objectives.
Types of Wedge and Triangle Chart Patterns
Having discussed the importance of risk management strategies for wedge and triangle chart patterns, it is also essential to become familiar with the types of these chart patterns. Generally speaking, wedge chart patterns can be bearish or bullish (upward or downward sloping), while triangle chart patterns can be ascending, descending, symmetrical, right-angled triangles, as well as other variations.
Regardless of the type of wedge/triangle pattern being traded, traders should always consider the risk-reward ratio when determining their entry/exit points. Furthermore, due to price dynamics in certain wedges/triangles that cause prices to break out in one direction or another after a period of consolidation.
Consequently, traders should also keep in mind that they may need to adjust their stop-loss levels accordingly. By considering all these factors when trading wedge/triangle chart patterns, traders can increase their chances of success. Ultimately this will allow them to position themselves better when interpreting these complex chart patterns.
Interpreting Wedge and Triangle Chart Patterns
Interpreting wedge and triangle chart patterns requires careful consideration of various factors such as price dynamics, risk-reward ratios, and potential entry/exit points. When trading these chart patterns, one should consider the following:
- Price action: analyzing how the market has moved in the past to develop an understanding of what may happen in the future.
- Technical indicators: using various techniques to measure momentum or other market conditions.
- Risk-reward Ratios: assessing potential profits versus potential losses associated with a trade setup.
- Entry/Exit Points: determining where to enter and exit a position based on price targets or technical signals.
These considerations are key for successful trading of wedge and triangle chart patterns, since they can help minimize risks while providing opportunities for potentially lucrative trades.
As such, it is important to understand them before engaging in any trades involving these chart patterns. With this knowledge, traders can better navigate the markets with confidence and avoid common mistakes when trading wedge and triangle chart patterns.
Common Mistakes to Avoid With Wedge and Triangle Chart Patterns
When interpreting wedge and triangle chart patterns, it is important to not fall prey to common mistakes. Psychological pitfalls can come into play when trading these types of patterns, leading to costly errors in judgment. To avoid such pitfalls, risk assessment must be taken into consideration before investing.
It is also important to understand the underlying trend and confirm the pattern with other indicators. In addition, traders should be aware of false breakouts which can result in losses if not dealt with properly. Furthermore, traders must keep emotions in check as fear or greed may lead to poor decision making.
Lastly, it is essential for traders to practice proper money management techniques and use appropriate stop loss orders that are tailored for each trade setup. By following these guidelines, traders can better ensure successful trades using wedge and triangle chart patterns on the forex market.
Conclusion
In conclusion, “How to Trade Wedge and Triangle Chart Patterns” unveils the art of leveraging technical analysis for successful trading. By mastering the nuances of wedge and triangle patterns, traders gain a competitive edge in identifying potential breakouts and trend reversals. However, it’s crucial to complement pattern recognition with effective risk management strategies.
As you delve into the world of chart analysis, let this guide be your trusted companion, providing you with the tools and insights needed to navigate the complexities of the financial markets. With diligence and practice, you can harness the power of these patterns to enhance your trading proficiency and achieve your financial goals.
References
- Can deep learning improve technical analysis of forex data to predict future price movements?
- Does high frequency trading affect technical analysis and market efficiency? And if so, how?
- Evaluation of the profitability of technical analysis for Asian currencies in the forex spot market for short-term trading
- Could a trader using only “old” technical indicator be successful at the Forex market?
Frequently Asked Questions
What Other Chart Patterns Are Commonly Used in Forex Trading?
Other chart patterns commonly used in forex trading include head and shoulders, double/triple tops/bottoms, and flags. These trends can be identified through analysis of price action on charts and help traders make decisions about money management. Knowing how to properly identify these patterns is key to successful forex trading.
What Timeframes Are Best for Analyzing Wedge and Triangle Chart Patterns?
Statistics indicate that Forex traders often use price action and risk management to analyze wedge and triangle chart patterns. Best timeframes generally depend on the trader’s strategy, but higher time frames of 4 hours or more are generally favored due to their ability to provide a larger picture of market trends.
How Often Should I Look for Wedge and Triangle Chart Patterns?
Price action and risk management should be taken into consideration when looking for wedge and triangle chart patterns. Analyzing regularly can help traders identify potential trends, however frequency of analysis depends on market conditions, trading style and time frames. To maximize success finding these patterns, traders should stay up to date with market news and carefully monitor price movements.
What Are the Most Important Indicators to Use When Analyzing Wedge and Triangle Chart Patterns?
Analyzing wedge and triangle chart patterns requires an understanding of essential indicators, such as support/resistance levels, price action, and risk management. Accurately assessing these factors enables the trader to make informed decisions in a data-driven manner. Analysing with precision allows one to potentially maximize profits while minimizing losses.
Are There Any Other Tips or Strategies for Successfully Trading Wedge and Triangle Chart Patterns?
When trading wedge and triangle chart patterns, short term strategies and risk management are key to success. Utilizing a well-thought out plan that accounts for market volatility can help ensure profits while minimizing risks. Analyzing trends and taking advantage of opportunities in the short run can also lead to success.


