

Delve into the art of technical analysis with our guide on “Key Point to Identify the Direction of RSI Indicators.” Mastering the Relative Strength Index (RSI) is a pivotal skill for traders and investors alike. By deciphering the RSI’s signals, you gain valuable insights into potential market trends.
This guide illuminates the crucial factors for interpreting RSI movements, from overbought and oversold conditions to bullish and bearish divergences. Join us as we unravel the secrets to effectively using RSI indicators to make informed trading decisions, giving you a distinct edge in the dynamic world of financial markets.
Key Takeaways
- RSI measures price momentum and can identify potential reversals.
- RSI levels above 70 indicate overbought conditions, while levels below 30 indicate oversold conditions.
- RSI can confirm uptrends or downtrends observed through other indicators.
- RSI divergence, both bearish and bullish, can help identify trend reversals and potential trade opportunities.
Understanding RSI (Relative Strength Index)
The Relative Strength Index (RSI) is a commonly used technical indicator in financial analysis that measures the strength and magnitude of price movements to determine overbought or oversold conditions in a security. It helps traders identify potential trend reversals and generate buy or sell signals. Applying RSI in trend analysis involves analyzing the relationship between the RSI value and the price movement of a security over a specific timeframe. Traders typically use RSI in conjunction with other technical indicators to confirm trends and make more informed trading decisions.
One important factor to consider when interpreting RSI is the timeframe used. Different timeframes can result in different interpretations of RSI levels. For example, using a shorter timeframe may provide more frequent but less reliable signals, while using a longer timeframe may produce fewer but more reliable signals. Traders need to select an appropriate timeframe based on their trading strategy and risk tolerance.
In conclusion, understanding how to apply RSI in trend analysis and considering the importance of timeframe are crucial aspects of effectively utilizing this technical indicator. By incorporating these factors into their analysis, traders can gain valuable insights into market trends and make more informed trading decisions.
Now that we have discussed applying RSI in trend analysis and the importance of timeframe, we will move on to interpreting RSI levels for further insights into market conditions.
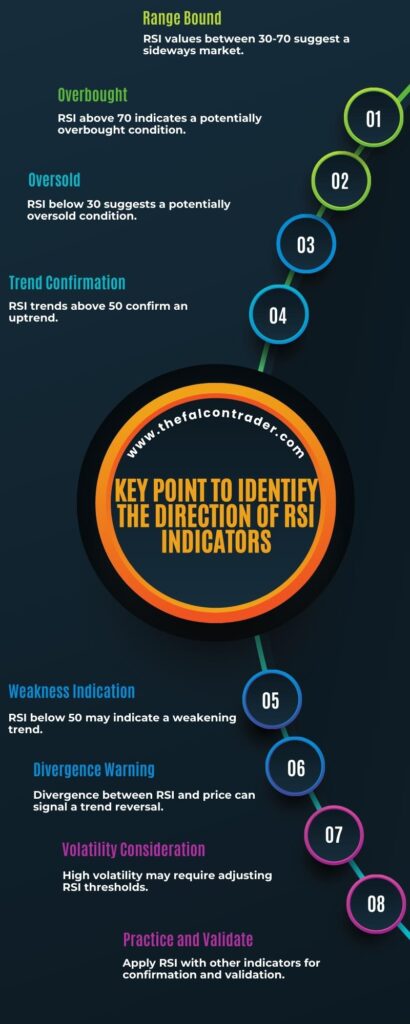
Key Point to Identify the Direction of RSI Indicators
One approach to comprehending RSI levels involves examining the numerical values in order to determine potential trends or shifts in market sentiment. The Relative Strength Index (RSI) is a technical indicator that measures the strength and speed of price movements. It provides insights into whether a security is overbought or oversold, which can be useful for identifying potential trend reversals.
An RSI value above 70 is considered overbought, indicating that the security may be due for a downward correction. Conversely, an RSI value below 30 is considered oversold, suggesting that the security may be due for an upward correction. Traders often use these overbought and oversold levels as signals to enter or exit trades.
Additionally, RSI can also be used to confirm trends observed through other technical indicators or chart patterns. For example, if a stock price is making higher highs and higher lows, and its RSI remains above 50, this could signal a strong uptrend. On the other hand, if a stock price is making lower highs and lower lows, and its RSI remains below 50, this could indicate a strong downtrend.
By analyzing RSI levels in conjunction with other technical indicators and chart patterns, traders can gain further confirmation of potential market trends and make more informed trading decisions.
| Condition | Interpretation |
|---|---|
| RSI > 70 | Overbought |
| RSI < 30 | Oversold |
| Price Uptrend & RSI > 50 | Confirmation of bullish trend |
| Price Downtrend & RSI < 50 | Confirmation of bearish trend |
Table: Interpreting Different Conditions of Relative Strength Index (RSI)
This analytical approach allows investors to assess market sentiment objectively based on numerical values provided by the RSI indicator.
Identifying Bullish Signals in RSI
By examining numerical values and observing price trends, potential bullish signals can be identified in the Relative Strength Index (RSI). The RSI is a momentum oscillator that measures the speed and change of price movements. It provides insights into whether an asset is overbought or oversold. To identify bullish signals in the RSI, traders look for specific patterns and conditions.
One common pattern is the bullish divergence. This occurs when the price of an asset makes lower lows while the RSI makes higher lows. This suggests that despite downward pressure on prices, buying interest is increasing, indicating a potential reversal to the upside.
Another indicator of a bullish signal is when the RSI rises from oversold conditions (typically below 30) and crosses above its 50 level. This indicates a shift in momentum from bearish to bullish.
Additionally, traders also watch for breakouts from consolidation patterns accompanied by high RSI readings as they suggest strong buying pressure.
It’s important to note that these indicators are not foolproof and should be used in conjunction with other technical analysis tools for confirmation. Furthermore, proper risk management strategies should always be employed when trading based on RSI patterns.
Recognizing Bearish Signals in RSI
Recognizing bearish signals in the RSI involves analyzing price trends and numerical values to identify patterns and conditions that suggest a potential reversal to the downside. The Relative Strength Index (RSI) is a popular technical indicator used by traders and investors to assess the strength and direction of price movements in a given security or market.
When it comes to identifying bearish signals in the RSI, there are several key points to consider:
- Identifying oversold conditions in RSI: One way to recognize bearish signals is by looking for oversold conditions in the RSI. This occurs when the RSI falls below a certain threshold, typically 30. An oversold condition suggests that the asset may be due for a rebound or reversal to the downside.
- Using RSI for trend confirmation: Another method of identifying bearish signals is by using the RSI as a tool for confirming downtrend patterns. If the RSI remains below a certain level, such as 50, while prices continue to decline, it can be seen as an indication that selling pressure is strong and likely to persist.
- Using RSI for reversal signals: In addition to trend confirmation, traders also look for specific patterns or divergences in the RSI that signal potential reversals. For example, if prices are making lower lows but the RSI is making higher lows, it could indicate underlying bullish momentum building up and potentially lead to a price reversal.
By understanding these key points and carefully analyzing price trends and numerical values within the context of these conditions, traders can effectively recognize bearish signals in the RSI. This knowledge can then be applied in conjunction with other technical indicators or analysis techniques to make informed trading decisions.
Using RSI Divergence to Predict Price Reversals
Examining the divergence between price movements and the Relative Strength Index (RSI) can provide valuable insights for predicting potential reversals in asset prices. RSI divergence is a powerful tool used by traders to identify trend reversals and potential trade opportunities. By comparing the direction of price movements with the RSI indicator, traders can gain insights into the underlying strength or weakness of a trend.
Using RSI divergence in trend trading involves looking for discrepancies between price action and the RSI indicator. When an asset’s price makes higher highs while its RSI makes lower highs, it indicates bearish divergence. Conversely, when an asset’s price makes lower lows while its RSI makes higher lows, it suggests bullish divergence. These divergences often precede major reversals in asset prices.
Applying RSI divergence to determine trade entries involves waiting for confirmation signals before taking action. Traders may use additional technical analysis tools such as support and resistance levels or candlestick patterns to validate their trade decisions.
Conclusion
In conclusion, understanding the nuances of RSI indicators is a cornerstone of successful technical analysis. By honing your ability to identify overbought and oversold conditions, as well as discerning bullish and bearish divergences, you empower yourself to make astute trading decisions. The RSI provides a powerful tool to gauge market sentiment and potential trend reversals.
Let this guide serve as your roadmap to navigating the complexities of RSI analysis, enabling you to confidently interpret its signals and stay ahead of market movements. With a keen eye and a solid grasp of RSI dynamics, you gain a distinct advantage in the competitive landscape of financial trading.
References
- Opening an Account: How to Select a Forex Broker, and Set Up and Fund a Trading Account
- Forex Analysis: An Introduction and Comparison of Fundamental and Technical Analysis
- What Makes Currencies Move? An Exploration of the Key Forces That Cause Currencies to Fluctuate
- Pitfalls and Risks: Understanding the Risks of Forex and the Mistakes that New Traders Make
Frequently Asked Questions
How Can I Calculate the RSI Indicator for a Specific Time Period?
Calculating RSI values involves a mathematical formula that takes into account the average gains and losses over a specific time period. The interpretation of RSI readings is based on the level of overbought or oversold conditions in the market.
Are There Any Limitations to Using RSI as a Standalone Indicator for Predicting Market Direction?
The limitations of using RSI as a standalone indicator for predicting market direction include potential drawbacks in relying solely on RSI. These limitations encompass factors such as false signals, sensitivity to market conditions, and the need for additional analysis methods.
Can RSI Be Used Effectively in All Types of Markets, Such as Trending or Ranging Markets?
The effectiveness of RSI indicators in different types of markets, such as trending or ranging markets, depends on their pros and cons. In volatile markets, RSI can provide valuable insights but may also generate false signals. In choppy or sideways markets, interpreting RSI readings requires considering key thresholds and patterns to identify potential reversals or continuation of trends.
What Other Technical Indicators Can Be Used in Combination With RSI to Confirm Signals?
The confirmation of signals generated by the Relative Strength Index (RSI) can be achieved through the utilization of other technical indicators such as Moving Average Convergence Divergence (MACD) and Bollinger Bands.
Are There Any Specific Timeframes in Which RSI Is More Reliable for Predicting Market Direction?
The reliability of RSI indicators for predicting market direction may vary depending on specific timeframes. Further analysis is required to determine which timeframes consistently yield more reliable results in terms of prediction accuracy.


