

Dive into the captivating world of technical analysis with our comprehensive guide on “Types of Candlestick Patterns.” In the realm of financial markets, candlestick patterns serve as powerful indicators, offering insights into price movements and potential trends. From the bullish engulfing pattern to the doji and evening star, each candlestick formation tells a unique story about market sentiment and momentum. This guide unveils the significance of these patterns and equips you with the knowledge to interpret and utilize them effectively. Join us on this enlightening journey as we explore the intricacies of candlestick patterns and empower you to make informed trading decisions.
Key Takeaways
- Morning Star Pattern and Evening Star Pattern are candlestick patterns that suggest potential trend reversals.
- Piercing Pattern is a bullish reversal pattern during a downtrend, while Dark Cloud Cover Pattern is a bearish reversal pattern during an uptrend.
- Harami Pattern is an important pattern for identifying trend reversals or continuations, with Bullish Harami indicating a potential bullish reversal and Bearish Harami indicating a potential bearish reversal.
- Candlestick pattern analysis plays a significant role in trading by providing valuable insights into market sentiment and potential price movements, and can be used with other technical indicators or chart patterns for confirmation.
Types Of Candlestick Patterns
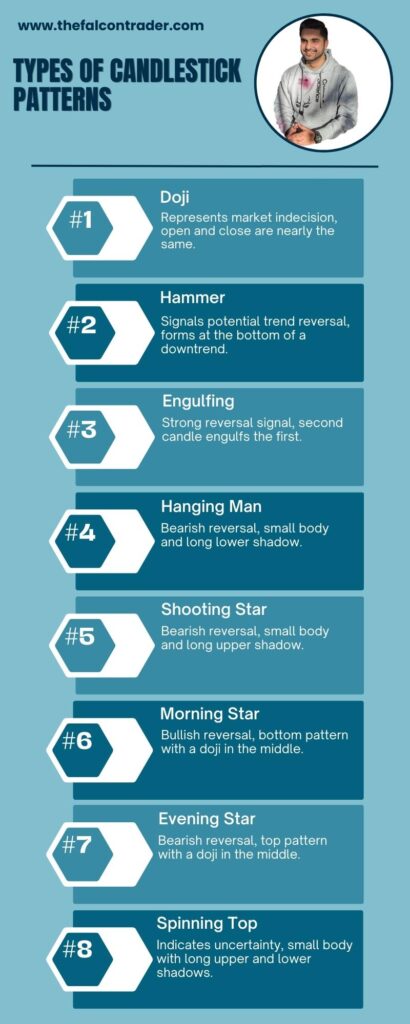
Candlestick patterns provide valuable insights into price movements and trends in financial markets. Here are some key types of candlestick patterns:
- Doji: Signifying market indecision, a Doji has an open and close price that are nearly the same. It can indicate a potential reversal.
- Hammer: A bullish reversal pattern, the Hammer has a small body and a long lower shadow, suggesting a potential upward trend.
- Engulfing: This pattern involves a smaller candle being engulfed by a larger one in the opposite direction, indicating a possible trend reversal.
- Morning Star: A three-candle pattern, the Morning Star suggests a potential bullish reversal. It starts with a downtrend, followed by a small candle, and ends with a strong bullish candle.
- Evening Star: The opposite of the Morning Star, this pattern indicates a potential bearish reversal. It starts with an uptrend, followed by a small candle, and ends with a strong bearish candle.
- Harami: Consisting of two candles, the Harami suggests a possible trend reversal. The second candle is smaller and within the range of the first one.
- Shooting Star: Similar to the Hammer, the Shooting Star is a bearish reversal pattern. It has a small body and a long upper shadow, indicating potential downward movement.
Candlestick patterns offer traders valuable insights into market sentiment and potential price changes. It’s crucial to combine these patterns with other technical and fundamental analysis tools for informed decision-making.

Bullish Engulfing Pattern
The Bullish Engulfing Pattern is a significant candlestick pattern in technical analysis. It occurs when a small bearish candlestick is followed by a larger bullish candlestick, engulfing the entire range of the previous candlestick. This pattern is considered to be a strong bullish signal, indicating a potential reversal in the market trend. It suggests that buyers have gained control over sellers, leading to an upward move in price.
To identify a bullish engulfing pattern, traders look for two key components. First, there must be a small bearish candlestick that represents selling pressure. Second, this bearish candle must be followed by a larger bullish candle that completely engulfs the previous one. The larger size of the second candle signals increased buying pressure and potential upward momentum.
Candlestick analysis plays an essential role in understanding market sentiment and predicting future price movements. Traders use these patterns to make informed decisions about when to enter or exit trades. The bullish engulfing pattern provides valuable insights into investor behavior and can help identify opportunities for profit.
Transitioning into the subsequent section about ‘bearish engulfing pattern,’ it is important to recognize that while the bullish engulfing pattern indicates strength and potential for an uptrend, its counterpart – the bearish engulfing pattern – signals weakness and potential for a downtrend.
Bearish Engulfing Pattern
Characterized by a large bearish candlestick that engulfs the previous bullish candlestick, the Bearish Engulfing Pattern signifies a potential reversal in price movement. This pattern is considered to be one of the most reliable candlestick reversal signals and is commonly used by traders to identify bearish trends.
Here are four key characteristics of the Bearish Engulfing Pattern:
- Size: The bearish candle in this pattern must be significantly larger than the preceding bullish candle, indicating strong selling pressure.
- Color: The first candle should be a bullish (green or white) candle, while the second should be a bearish (red or black) candle.
- Engulfing: The body of the second bearish candle must completely engulf or cover the body of the previous bullish candle, signaling a shift in market sentiment from buying to selling.
- Confirmation: Traders often wait for confirmation in subsequent candles before taking action based on this pattern.
By recognizing these characteristics and using technical analysis tools, traders can effectively identify and capitalize on potential trend reversals indicated by the Bearish Engulfing Pattern.
Transitioning into the subsequent section about ‘doji patterns,’ it is important to explore another significant type of reversal signal.
Doji Pattern
One striking feature of the Doji Pattern is its resemblance to a crossroads, indicating an indecisive market sentiment and potential trend reversal. The Doji pattern is formed when the opening price and closing price of an asset are almost equal, resulting in a small or nonexistent body with long upper and lower shadows. This pattern suggests that buyers and sellers are evenly matched, leading to a temporary halt in the prevailing trend.
The interpretation and significance of the Doji pattern depend on its variations. The four common types include the Gravestone Doji, Dragonfly Doji, Long-Legged Doji, and Four Price Doji. Each variation provides valuable insights into market behavior. For instance, a Gravestone Doji indicates a potential reversal from an uptrend to a downtrend, while a Dragonfly Doji suggests the opposite.
To evoke an emotional response in the audience, consider this table:
| Variation | Description |
|---|---|
| Gravestone | Bearish reversal signal; signifies potential downtrend |
| Dragonfly | Bullish reversal signal; signifies potential uptrend |
| Long-Legged | Indecisiveness between buyers and sellers; possible trend reversal |
| Four Price | Indicates significant market indecision; often seen during periods of high volatility |
Understanding the different variations of doji patterns allows traders to make more informed decisions based on market sentiment.
Transitioning into the subsequent section about ‘hammer and hanging man patterns,’ these candlestick formations provide further insights into market trends without compromising precision or reliability.
Hammer and Hanging Man Patterns
Hammer and Hanging Man patterns offer valuable insights into market trends, providing traders with reliable information to make informed decisions.
The hammer pattern is a bullish reversal pattern that occurs during a downtrend. It consists of a small body at the top end of the candlestick, with a long lower shadow. This formation indicates that sellers were initially in control, pushing prices lower, but buyers managed to regain control by the end of the session, resulting in a potential trend reversal.
On the other hand, the hanging man pattern is a bearish reversal signal that appears during an uptrend. It has a small body at the top end of the candlestick, with a long lower shadow. This formation suggests that buyers were dominant initially and pushed prices higher but lost momentum towards the end of the session. It may indicate an upcoming trend reversal or consolidation.
Both patterns are significant because they provide essential information about market sentiment and potential reversals in price direction. Traders can use these patterns as signals to enter or exit positions accordingly.
Transitioning into the subsequent section about ‘shooting star and inverted hammer patterns,’ these candlestick formations also play crucial roles in identifying trends and potential reversals in financial markets.
Shooting Star and Inverted Hammer Patterns
The shooting star and inverted hammer formations serve as important indicators of potential trend reversals in financial markets. These unique candlestick shapes provide traders with valuable insights into market sentiment and price direction.
The shooting star pattern is characterized by a small body located at the bottom end of the candle, with a long upper shadow that is at least twice the length of the body. This formation suggests that buyers initially pushed prices higher but encountered strong selling pressure, resulting in a potential reversal.
On the other hand, the inverted hammer pattern has a small body at the top end of the candle, with a long lower shadow that is at least twice the length of the body. This indicates that sellers initially drove prices lower but faced significant buying interest, suggesting a possible trend reversal.
When trading using these patterns, traders often wait for confirmation signals before taking action. For shooting stars, this could involve waiting for prices to break below the low of the formation or observing bearish follow-through in subsequent candles. In contrast, confirmation for inverted hammers may come from prices breaking above the high of the pattern or witnessing bullish continuation in ensuing candles.
Transitioning to our next section on morning star and evening star patterns…
Morning Star and Evening Star Patterns
Morning Star and Evening Star formations are powerful candlestick patterns that provide traders with important information about potential trend reversals in financial markets.
The Morning Star pattern consists of three candles: a long bearish candle, followed by a small bullish or bearish candle with a gap down, and finally, a long bullish candle that closes at least halfway up the first bearish candle. This pattern suggests that selling pressure is weakening and buyers may be entering the market, indicating a possible reversal from a downtrend to an uptrend.
On the other hand, the Evening Star pattern is the opposite of the Morning Star. It also consists of three candles: a long bullish candle, followed by a small bullish or bearish candle with a gap up, and finally, a long bearish candle that closes at least halfway down the first bullish candle. This pattern indicates that buying pressure is diminishing and sellers may be taking control, suggesting a potential reversal from an uptrend to a downtrend.
Identification techniques for these patterns include analyzing the size and shape of each candle as well as their position relative to each other. Traders can use these patterns to develop trading strategies such as entering into trades when confirmed by other technical indicators or setting stop-loss orders to limit potential losses.
If interested you can read about the top 3 trading books here. Moreover, you can read the top 3 hacks to transform you in a disciplined trader here.
Transitioning into the subsequent section about ‘piercing pattern and dark cloud cover pattern,’ these two additional patterns also provide valuable insights into market reversals.
Piercing Pattern and Dark Cloud Cover Pattern
In the realm of technical analysis, traders often pay close attention to the Piercing Pattern and Dark Cloud Cover Pattern as they offer valuable insights into potential market reversals.
The Piercing Pattern is a bullish reversal pattern that occurs during a downtrend. It consists of two candlesticks: a long bearish candle followed by a bullish candle that opens below the previous day’s close but closes above its midpoint. This pattern suggests that buying pressure is overcoming selling pressure, indicating a possible trend reversal.
On the other hand, the Dark Cloud Cover Pattern is a bearish reversal pattern observed in an uptrend. It also consists of two candlesticks: a long bullish candle followed by a bearish candle that opens above the previous day’s high but closes below its midpoint. This pattern indicates that selling pressure is increasing, potentially leading to a downward price movement.
Both patterns are considered significant as they provide clues about market sentiment and can assist traders in making informed decisions. These patterns are particularly useful when confirmed with other technical indicators or chart patterns.
Next, we will explore another important type of candlestick pattern known as the harami pattern, which includes both bullish harami and bearish harami patterns.
Harami Pattern
An important candlestick pattern to consider is the harami pattern, which consists of both bullish and bearish harami patterns. Candlestick pattern analysis plays a significant role in trading as it helps traders identify potential reversals or continuations in price trends.
The harami pattern is formed when a small candle appears within the body of a larger candle from the previous session. This smaller candle represents indecision in the market, suggesting that a trend reversal may occur.
The significance of the harami pattern lies in its ability to provide valuable insights into market sentiment and potential price movements. When a bullish harami pattern forms, it indicates that selling pressure has weakened and buying momentum may be building up. On the other hand, a bearish harami pattern suggests that buying pressure has subsided and selling interest might be increasing.
To better understand the implications of the harami pattern, consider these sub-lists:
- Bullish Harami Pattern:
- Indicates potential trend reversal from bearish to bullish.
- Suggests buying opportunities for traders.
- Bearish Harami Pattern:
- Signals possible trend reversal from bullish to bearish.
- Implies selling opportunities for traders.
By recognizing and interpreting these patterns correctly, traders can make more informed decisions about entering or exiting positions, enhancing their chances of successful trading outcomes.
Therefore, incorporating harami patterns into candlestick analysis can improve trading strategies and increase profitability for investors seeking belonging within this financial realm.
Conclusion
In conclusion, “Types of Candlestick Patterns” serve as invaluable tools for traders seeking to decode the language of the markets. Each pattern carries its own significance, offering insights into potential trend reversals, continuation patterns, and price action dynamics. By mastering the art of recognizing and interpreting candlestick patterns, traders gain a competitive edge in the world of technical analysis. As you delve into this captivating realm, let this guide be your companion, illuminating the path towards honing your trading skills and making informed decisions. Embrace the power of candlestick patterns and harness their potential to elevate your trading journey to new heights.
References
- Lessons from the evolution of foreign exchange trading strategies
- Application of neural network for forecasting of exchange rates and forex trading
- Multi-agent forex trading system
- Short-term predictions in forex trading
Frequently Asked Questions
What is the significance of the color of the candlestick in the Bullish Engulfing Pattern?
The color of the candlestick in a bullish engulfing pattern is significant as it indicates a shift from bearish sentiment to bullish. For example, if the first candle is red and the second candle is green, it suggests a reversal in market direction. Additionally, the impact of a doji pattern on market indecision can also influence the significance of color in this pattern.
Can the Bearish Engulfing Pattern be used to predict a major market reversal?
The bearish engulfing pattern is often used as a signal for a potential major market reversal. This pattern occurs when a larger bearish candle engulfs the previous bullish candle, suggesting a shift in market sentiment towards selling pressure.
How does the presence of a Doji Pattern indicate indecision in the market?
The presence of a doji pattern in the market indicates indecision among traders, as it represents a situation where the opening and closing prices are very close or equal. This suggests that neither buyers nor sellers have control, leading to uncertainty and potential for a market reversal.
What is the difference between a Hammer and a Hanging Man Pattern?
The difference between a hammer and a hanging man pattern lies in their position within a trend. Both are identifying candlestick patterns, with the hammer indicating a potential reversal after a downtrend, while the hanging man suggests a possible reversal after an uptrend.
The significance of candlestick color is crucial in the bullish engulfing pattern, where a white or green candle engulfs the previous black or red one, indicating potential market reversal. Conversely, the bearish engulfing pattern predicts market reversal when a black or red candle engulfs the previous white or green one.
The doji pattern signifies market indecision as it represents an equal opening and closing price, suggesting uncertainty among traders. Regarding reliability in predicting market reversals, both shooting star and inverted hammer patterns have shown effectiveness based on historical data analysis.
Are Shooting Star and Inverted Hammer Patterns equally reliable in predicting a reversal in the market?
The reliability of the shooting star and inverted hammer patterns in predicting a market reversal can vary. Studies suggest that both patterns have shown some degree of accuracy, but their effectiveness may depend on other factors such as volume and trend confirmation.


