

In the captivating world of the stock market, understanding the different types of gaps in the stock market is a fundamental skill for traders and investors alike. These gaps serve as intriguing indicators of market sentiment and can offer valuable insights into potential price movements.
In this comprehensive guide, we delve into the intricacies of common gap patterns, such as breakaway gaps, exhaustion gaps, and runaway gaps, among others. Join us as we explore the significance of these gaps and how they can be harnessed as powerful tools to enhance your trading strategies and capitalize on market opportunities.
Key Takeaways
- Runaway gaps indicate a continuation of the existing trend and can be used to confirm the strength of the trend.
- Island reversal gaps suggest a potential reversal in the prevailing trend and can be used as a signal to enter or exit positions.
- Confirmation signals such as volume spikes or support/resistance levels are often considered alongside island reversal gaps.
- Proper risk assessment and management, including the use of stop-loss orders and position-sizing techniques, are crucial when dealing with gaps in the stock market.
Types Of Gaps In The Stock Market
Gaps in the stock market refer to a significant difference between the closing price of a security on one day and its opening price on the following day. These gaps can occur due to various factors such as news releases, economic events, or changes in investor sentiment.
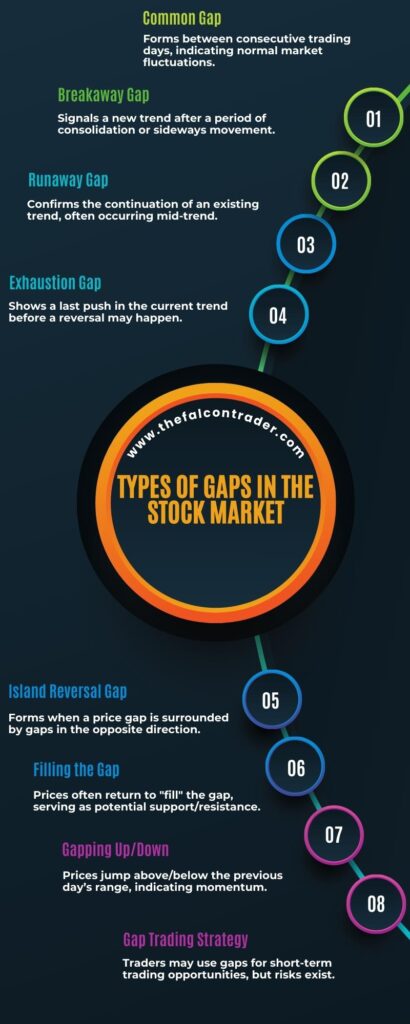
By examining breakaway gaps, common gaps, exhaustion gaps, measuring gaps, runaway (continuation) gaps, and island reversal gaps, investors can gain a deeper understanding of how these patterns may indicate future price movements.
- Breakaway gaps, which often signal a change in trend, are characterized by a significant price movement accompanied by high trading volume.
- Common gaps, on the other hand, are typically formed when there is a lack of trading activity and can be seen as areas of consolidation or indecision.
- Exhaustion gaps occur near the end of a trend and indicate that buying or selling pressure has been exhausted. These gaps are often followed by a reversal in the opposite direction.
- Measuring gaps are used to determine potential price targets based on the size of the gap itself.
- Runaway (continuation) gaps occur within an established trend and suggest that the prevailing trend will continue. They often occur after periods of consolidation or retracement and can provide traders with opportunities to enter trades in the direction of the overall trend.
- Island reversal gaps form when there is a gap up or down followed by another gap in the opposite direction, leaving an ‘island’ of prices isolated from previous trading levels. This type of gap indicates a potential reversal in sentiment and can be significant for technical analysis.
By equipping ourselves with knowledge about these gap types and their implications, we can enhance our decision-making process when participating in the dynamic world of stock market trading.
Breakaway Gaps
Breakaway gaps in the stock market occur when there is a significant price movement that breaks through a previous trend, creating a gap between the closing price of one day and the opening price of the next day. These gaps are important to traders as they provide potential profit opportunities.
Breakaway gap trading strategies involve identifying breakaway gaps in stock charts and using them as entry or exit points for trades. Identifying breakaway gaps in stock charts requires careful analysis of price patterns and volume indicators. Traders often look for strong and sudden price movements accompanied by high trading volumes to indicate a breakaway gap. This suggests a shift in market sentiment and can be seen as an indication of future trends. Additionally, technical indicators such as moving averages or support/resistance levels can be used to confirm the presence of a breakaway gap.
Once identified, breakaway gaps can be utilized in various trading strategies. Some traders may choose to enter positions based on the assumption that the price will continue moving in the direction of the gap, taking advantage of momentum. Others may wait for a pullback or consolidation before entering their trades, aiming to capture potential reversals or trend continuations. Stop-loss orders are commonly placed below or above the gap’s range to manage risk.
Breakaway gaps in the stock market represent significant shifts in market sentiment and offer potential trading opportunities. By using specific techniques like analyzing price patterns, volume indicators, and additional technical tools, traders can identify these gaps on stock charts. Breakaway gap trading strategies involve entering positions based on momentum or waiting for pullbacks/consolidations before entering trades. Understanding how to spot and utilize breakaway gaps is essential for successful participation in today’s dynamic stock market.

Moving onto ‘common gaps,’ we delve into another type of gap that deserves attention within this context without any explicit mention of stepping into it directly from here onwards.
Common Gaps
Another type of gap commonly observed in the stock market is known as a common gap, which is characterized by a sudden shift in prices that occurs within an established trend. Common gaps are typically formed when there is a temporary pause or consolidation in the movement of stock prices before they continue in the same direction. These gaps are often seen as a continuation pattern and can provide valuable insights for traders looking to capitalize on trend-following strategies.
To better understand common gaps, here are four key characteristics:
- Occurrence within an established trend: Common gaps occur during ongoing trends and serve as brief pauses or retracements before the trend resumes its course. They provide traders with an opportunity to enter positions aligned with the prevailing market direction.
- Volume patterns: Unlike other types of gaps, common gaps tend to have average volume levels and lack significant spikes in trading activity. This suggests that common gaps may not be driven by major news events or sudden shifts in market sentiment.
- Size and duration: Common gaps are usually smaller in size compared to breakaway or exhaustion gaps. They represent minor fluctuations within the overall price movement, lasting only a few days before being filled.
- Trading strategies: Traders often use common gaps as entry points for their trades by placing stop orders above or below the gap’s range, depending on whether it’s an upward or downward trend. This allows them to capture potential profits if the price continues moving in their desired direction.
Understanding different types of gaps in the stock market, such as common gaps, can help traders develop effective gap trading strategies that align with market trends and capitalize on profit opportunities presented by these patterns.
Transitioning into the subsequent section about ‘exhaustion gaps,’ it is important to note that while common gaps indicate temporary pauses within established trends, exhaustion gaps signify potential reversals or endings of existing trends. By studying these various types of gaps and their implications, traders can enhance their decision-making process and increase their chances of success in the stock market.
Exhaustion Gaps
Exhaustion gaps, in contrast to common gaps, indicate a potential reversal or termination of existing trends in the price movement. These gaps occur when there is a significant gap between the closing price of one trading session and the opening price of the next, suggesting that market participants are exhausted and no longer willing to sustain the current trend.
Traders and investors often look for exhaustion gaps as they can provide valuable insights into potential turning points in the market. Identifying exhaustion gaps in stock charts requires careful analysis and understanding of chart patterns. Traders typically search for these gaps after an extended uptrend or downtrend, as they represent a shift in sentiment and can signal an upcoming change in direction. The size and location of the gap are also important factors to consider. A larger gap may indicate a stronger exhaustion signal, while its proximity to support or resistance levels can provide further confirmation.
To implement exhaustion gap trading strategies successfully, traders often combine technical indicators with chart patterns. For example, some traders may use moving averages or oscillators to confirm whether there is enough momentum behind a potential reversal. Additionally, monitoring volume can be helpful as increased volume during an exhaustion gap suggests heightened market participation.
Exhaustion gaps serve as essential tools for traders seeking to identify potential reversals or terminations in stock market trends. By carefully analyzing stock charts and incorporating technical indicators and volume analysis, traders can develop effective trading strategies based on these gaps.
In the following section about ‘measuring gaps,’ we will explore different methods used by analysts to quantify these price discrepancies without explicitly stating ‘step’.
Measuring Gaps
Quantifying the disparity between closing and opening prices in price charts can be likened to measuring the distance between two distinct points on a map. Measuring techniques are employed to identify and analyze gaps in stock market data, as these gaps provide valuable insights into market trends and potential trading opportunities. The importance of identifying gaps lies in understanding the dynamics of supply and demand, as well as investor sentiment, which can significantly impact stock prices.
One commonly used technique for measuring gaps is known as “gap size measurement.”This method involves calculating the difference between the closing price of one day and the opening price of the next day. By quantifying this gap size, traders can gain an understanding of how significant a particular gap may be. A larger gap indicates a more significant shift in investor sentiment or market conditions, while a smaller gap suggests a relatively minor change.
Another technique used for measuring gaps is called “percentage measurement.”This method calculates the percentage difference between the closing price of one day and the opening price of the next day. By expressing gap size as a percentage, traders can compare gaps across different periods or stocks with varying prices. This allows for a more standardized approach to analyzing gaps and facilitates better comparisons.
Measuring techniques play a vital role in technical analysis by providing objective data to interpret market behavior. Identifying and analyzing gaps helps traders understand potential patterns or trends that may indicate future price movements. These techniques assist traders in making informed decisions about buying or selling stocks based on their interpretation of gap patterns.
Moving forward, it is important to explore another type of gap known as runaway (continuation) gaps without losing sight of our goal to understand various types of stock market gaps.
Runaway (Continuation) Gaps
A significant type of gap in price charts is the runaway (continuation) gap, which offers valuable insights into ongoing market trends and potential trading opportunities.
Runaway gaps occur during strong trending markets and indicate a continuation of the existing trend. These gaps are characterized by a significant price movement that occurs between two consecutive trading sessions, with the price opening above or below the previous day’s range.
Runaway gap analysis involves identifying these gaps and using them to confirm the strength of an ongoing trend. Traders can look for runaway gaps as a signal to enter or add to their positions in the direction of the prevailing trend. The size and volume associated with these gaps can provide additional confirmation of the trend’s strength.
By analyzing runaway gaps, traders can gain better insight into market dynamics and make more informed decisions about their trades.
Understanding and identifying runaway gaps is crucial for traders looking to capitalize on ongoing market trends. By analyzing these gaps, traders can confirm the strength of a trend and potentially identify profitable entry or exit points. The analysis involves examining the size, volume, and context in which these gaps occur.
With this information, traders can make more informed decisions about their trading strategies.
Island Reversal Gaps
Island reversal gaps are significant patterns in price charts that indicate a potential reversal in the prevailing trend, often characterized by a gap on both sides of a consolidation area.
For example, during a downtrend, an island reversal gap may occur when the price gaps are down and creates a consolidation area before gapping up again, signaling a potential reversal to an uptrend.
These patterns are widely studied and used by traders in their gap trading strategies.
Island reversal patterns stand out in price charts due to their unique formation. The presence of gaps on both sides of a consolidation area creates an ‘island’ of prices that is isolated from the surrounding trends.
This isolation can be seen as a sign that market sentiment is changing, potentially leading to a reversal in the prevailing trend.
Traders who spot these patterns may interpret them as opportunities to enter or exit positions based on their trading strategies.
Engaging with island reversal gaps requires careful analysis and consideration of other technical indicators.
Traders often look for confirmation signals such as volume spikes or support/resistance levels coinciding with the pattern formation.
By combining these additional factors with island reversals, traders aim to increase the probability of successful trades.
However, it’s important to note that no trading strategy is foolproof, and false signals can still occur.
Incorporating island reversal gaps into one’s trading strategy can provide traders with a sense of belonging within the market community.
Many traders actively seek out patterns like these and discuss them on various forums or social media platforms dedicated to stock trading.
By participating in these discussions and sharing experiences about using island reversals effectively, traders can satisfy their subconscious desire for belonging while also gaining valuable insights from others’ perspectives.
Understanding and utilizing island reversal patterns can be beneficial for traders employing gap trading strategies.
These distinctive formations offer potential opportunities for trend reversals but should always be analyzed alongside other technical indicators for confirmation signals.
By engaging with the trading community and sharing experiences, traders can enhance their understanding of these patterns and ultimately improve their risk management strategies.
Closing Thoughts and Risk Management
In our previous discussion on island reversal gaps, we explored how these unique chart patterns can indicate a reversal in trend. Now, let’s delve into some closing thoughts and consider the importance of risk management when dealing with such gaps.
When trading in the stock market, it is crucial to assess and manage risks effectively. Island reversal gaps can be enticing for traders looking to take advantage of a potential change in direction. However, it is important to remember that no trading strategy is foolproof, and there are always inherent risks involved. Therefore, risk assessment becomes paramount to protect one’s investments.
Managing volatility is another key aspect to consider when dealing with any type of gap in the stock market. Volatility refers to the magnitude of price fluctuations within a given period. Island reversal gaps often coincide with increased volatility as the market participants reassess their positions. Traders need to understand this volatility and adjust their risk management strategies accordingly.
To effectively manage risks associated with island reversal gaps, traders should adopt a disciplined approach that includes setting stop-loss orders and implementing proper position sizing techniques. Stop-loss orders help limit potential losses by automatically triggering an exit from a trade if prices move against expectations beyond a predetermined threshold. Position sizing ensures that trades are not overly concentrated in one particular asset or sector, reducing overall portfolio risk.
While island reversal gaps offer potential opportunities for traders, it is imperative to approach them with caution and employ sound risk management practices. By conducting thorough risk assessments and managing volatility effectively through tools like stop-loss orders and position-sizing techniques, traders can mitigate potential losses and enhance their chances of success in the stock market arena.
If you are new to the world of Forex, we highly recommend you read our beginner’s guide to Forex trading.
Conclusion
In conclusion, delving into the various types of gaps in the stock market opens a gateway to a deeper understanding of market dynamics and sentiment. Whether it’s breakaway gaps signaling the start of a new trend, exhaustion gaps indicating a potential reversal, or runaway gaps projecting ongoing momentum, each type provides valuable clues for traders and investors.
By recognizing and interpreting these gaps, market participants can make informed decisions, fine-tune their strategies, and seize opportunities to navigate the stock market with confidence. Embrace the power of gap analysis as a crucial component of your trading toolkit, unlocking the potential for enhanced profitability and success in the dynamic world of stocks.
References
- Technical analysis of Forex by MACD Indicator
- Extended evidence on the use of technical analysis in foreign exchange
- Can deep learning improve technical analysis of forex data to predict future price movements?
- Does high frequency trading affect technical analysis and market efficiency? And if so, how?
Frequently Asked Questions
What are the most common strategies for trading breakaway gaps in the stock market?
Breakaway gap trading strategies involve analyzing and capitalizing on breakaway gaps in the stock market. These strategies focus on identifying key indicators, such as volume and price patterns, to determine potential breakouts or breakdowns in stock prices.
How can traders identify exhaustion gaps and effectively use them in their trading decisions?
Traders can identify exhaustion gaps and effectively use them in their trading decisions by analyzing price patterns, volume, and market sentiment. Understanding the characteristics of exhaustion gaps allows traders to anticipate trend reversals and make informed trading choices.
Is there a reliable way to measure the potential impact of a gap on a stock’s price movement?
Reliable measurement for assessing the potential impact of a gap on a stock’s price movement is an essential aspect of trading. It enables traders to make informed decisions based on objective and analytical analysis.
What are the key characteristics of runaway (continuation) gaps and how can traders take advantage of them?
Continuation gaps in the stock market refer to price gaps that occur within an ongoing trend. These gaps indicate a continuation of the current trend and can present trading opportunities for investors. By identifying and analyzing these gaps, traders can make informed decisions to potentially profit from the continuation of the trend.
Are there any specific patterns or indicators that can help identify island reversal gaps in the stock market?
Indicators such as volume, price patterns, and moving averages can help identify island reversal gaps in the stock market. Traders can use these indicators to develop strategies for trading breakaway gaps effectively.


