

Embark on a journey towards profitable intraday trading with our curated list of the “10 Best Intraday Trading Strategies.” Intraday trading demands precision, agility, and a well-defined approach. This comprehensive guide unveils a selection of strategies tailored to harness short-term market movements.
From scalping to momentum trading and beyond, we provide insights into each technique’s strengths and considerations. Whether you’re a seasoned trader or just starting, these strategies serve as powerful tools in your trading arsenal. Join us as we delve into the intricacies of intraday trading, equipping you with the knowledge to navigate the dynamic world of financial markets.
Key Takeaways
- Moving average crossover can be used as a strategy to identify potential uptrends or downtrends in the market.
- Breakout trading involves identifying specific levels on a price chart where the market breaks out of a consolidation pattern, and traders can enter and exit positions based on confirmed breakouts.
- Range trading focuses on buying at the lower end and selling at the upper end of a specific price range where the market tends to fluctuate.
- Momentum trading involves capitalizing on established trends by entering positions at the early stages and using risk management techniques to protect capital.
10 Best Intraday Trading Strategies
The 10 best intraday trading strategies include
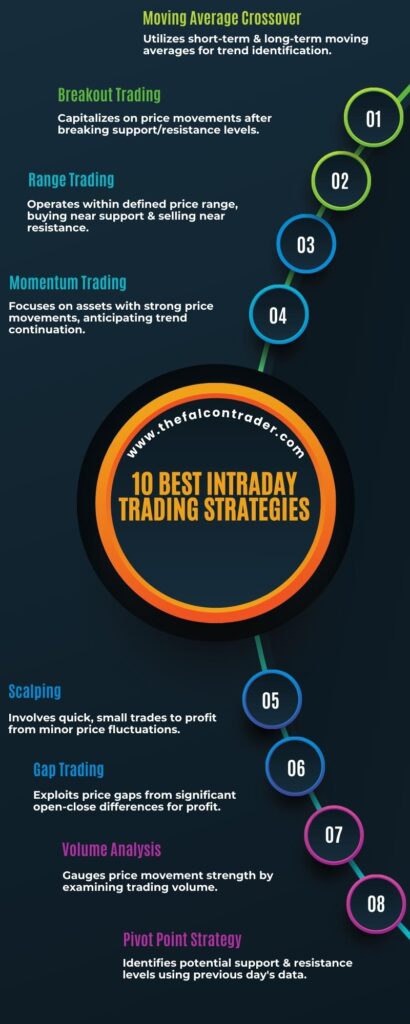
- Moving Average Crossover: This strategy uses two moving averages, typically a short-term and a long-term one. When the short-term moving average crosses above the long-term moving average, it generates a buy signal, and when it crosses below, it’s a sell signal. This helps traders identify trends and potential entry/exit points.
- Breakout Trading: Breakout traders aim to capitalize on price movements when an asset’s price breaks through a significant support or resistance level. This can signal the start of a strong trend, providing an opportunity for traders to enter early.
- Range Trading: Range traders operate within a defined price range. They buy near support levels and sell near resistance levels. This strategy is effective in sideways markets where price fluctuations are limited.
- Momentum Trading: Momentum traders focus on assets that are exhibiting strong price movements, either up or down. They buy assets that are gaining momentum, expecting the trend to continue, and sell those that are losing momentum.
- Scalping: Scalping involves making numerous small trades throughout the day to profit from minor price fluctuations. Scalpers aim for small, quick gains and typically hold positions for a very short time.
- Gap Trading: Gap trading involves exploiting price gaps that occur when an asset’s price opens significantly higher or lower than its previous closing price. Traders aim to profit as the price closes the gap.
- Volume Analysis: Volume analysis looks at trading volume to gauge the strength of price movements. High volume often confirms the validity of a price trend, while low volume may signal a potential reversal.
- Pivot Point Strategy: Pivot points are calculated based on the previous day’s high, low, and close. Traders use these points to identify potential support and resistance levels. Buying at or near support and selling at or near resistance can be part of this strategy.
- Fibonacci Retracement Strategy: Fibonacci retracement levels are used to identify potential reversal points in a price trend. Traders plot these levels on a chart to determine where an asset’s price might retrace before continuing its trend.
- Volume Weighted Average Price (VWAP): VWAP is a trading tool that calculates the average price of an asset based on its trading volume. Traders use it to identify fair value levels and potential trade entries and exits.
These strategies are employed by intraday traders based on their analysis of market conditions and individual preferences. It’s essential to thoroughly understand and practice these strategies before implementing them in real-time trading and to use proper risk management techniques to protect capital.
Moving Average Crossover
The moving average crossover is a commonly used intraday trading strategy that involves the comparison of short-term and long-term moving averages to identify potential buy or sell signals. Moving averages are calculated by taking the average price over a specified period, typically using closing prices. The short-term moving average, such as the 50-day moving average, reacts more quickly to recent price changes, while the long-term moving average, such as the 200-day moving average, reflects longer-term trends.
Moving average crossover analysis focuses on two main signals: the golden cross and the death cross. The golden cross occurs when the short-term moving average crosses above the long-term moving average, indicating a potential uptrend and suggesting a buy signal. Conversely, the death cross occurs when the short-term moving average crosses below the long-term moving average, signaling a potential downtrend and suggesting a sell signal.
Traders often use additional indicators or confirmations in conjunction with these crossovers to increase accuracy and reduce false signals. For example, volume analysis or other technical indicators can be used to validate potential trade opportunities identified through moving averages.
Breakout Trading
Breakout trading involves identifying a specific level on a price chart where the market breaks out of a consolidation pattern, indicating potential opportunities for traders. This strategy aims to capture significant price movements that occur after periods of consolidation. Traders typically use technical analysis tools to identify potential breakouts, such as trend lines, support and resistance levels, or chart patterns.
To engage the audience, here are four key aspects of breakout trading:
- Breakout confirmation: Traders look for validation of a breakout through increased volume analysis. Higher trading volume during a breakout suggests stronger market participation and increases the likelihood of sustained price movement in the direction of the breakout.
- Entry and exit points: Traders enter positions once the breakout is confirmed and set stop-loss orders below the breakout level to limit potential losses. They may also employ profit targets based on previous swing highs or other technical indicators.
- False breakouts: Breakouts can sometimes be false signals that result in whipsaw-like movements. Traders need to be cautious and wait for confirmation before entering trades.
- Pullbacks: After a successful breakout, price often retraces back to retest the previously broken level. These pullbacks can provide additional entry opportunities for traders who missed the initial breakout.
With an understanding of how breakout trading works, we can now explore another popular intraday trading strategy known as range trading.
Range Trading
Range trading involves identifying a specific price range in which the market tends to fluctuate, allowing traders to potentially profit from buying at the lower end of the range and selling at the upper end. Range trading is a popular strategy among intraday traders as it allows them to take advantage of predictable market movements within a defined range.
When engaging in range trading, it is essential for traders to have effective risk management strategies in place. This is because range trading carries its own set of risks, such as false breakouts and whipsaws. Traders must be able to identify when a breakout or breakdown occurs and exit their positions accordingly to minimize losses.
One commonly used risk management strategy in range trading is setting stop-loss orders. Stop-loss orders help limit potential losses by automatically closing positions if prices move beyond predetermined levels. Additionally, employing proper position sizing techniques can also help manage risk effectively.
Successful range trading requires careful analysis of historical price data and identification of key support and resistance levels. Technical indicators such as Bollinger Bands or Moving Averages can aid in determining these levels. Traders should also monitor volatility levels as increased volatility can lead to larger price swings, making it more challenging to execute profitable trades within the defined range.
Momentum Trading
Momentum trading involves capitalizing on the continuation of an established trend by entering trades in the direction of the prevailing market movement. This strategy is based on the belief that price trends tend to persist and that assets with positive momentum will continue to rise, while those with negative momentum will continue to fall. Momentum traders focus on identifying stocks or other financial instruments that are exhibiting strong upward or downward momentum and aim to profit from these trends.
To engage the audience, here are four important aspects of momentum trading:
- Trend analysis: Momentum traders heavily rely on analyzing price charts and technical indicators to identify trends. They look for patterns such as higher highs and higher lows in an uptrend or lower lows and lower highs in a downtrend.
- Entry and exit points: Timing is crucial in momentum trading. Traders seek to enter positions at the early stages of a trend when there is a high probability of continued price movement. They also use stop-loss orders to limit potential losses if the trend reverses.
- Risk management: Managing risk is essential in any trading strategy. Momentum traders typically use position sizing techniques and strict risk management rules to protect their capital.
- Volatility considerations: Volatile markets provide more opportunities for momentum trading since larger price swings can lead to stronger trends. However, increased volatility also entails higher risk, so proper risk assessment is necessary.
Scalping
Scalping is a trading strategy that focuses on taking advantage of quick profit potential through high trading frequency and tight stop-loss levels. It involves making short-term trades in order to capture small price movements within the market.
The main objective of scalping is to make multiple small profits throughout the day, rather than holding positions for extended periods of time.
Quick Profit Potential
One effective strategy for maximizing quick profit potential in intraday trading is to identify and capitalize on short-term price fluctuations. This approach, commonly known as scalping, involves taking advantage of small price movements within a single trading day.
To engage the audience and provide further insights into this strategy, the following bullet points are presented:
- Utilize technical analysis tools such as moving averages and oscillators to identify potential entry and exit points.
- Implement strict risk management techniques, including setting stop-loss orders to limit potential losses.
- Monitor market volatility to identify periods of high liquidity and increased trading opportunities.
- Constantly review and adjust trading strategies based on market conditions to optimize profit-taking opportunities.
By adhering to these principles of profit taking and risk management, intraday traders can increase their chances of capitalizing on short-term price fluctuations while minimizing potential losses.
It is essential for traders to remain disciplined and adapt their strategies according to changing market dynamics in order to achieve consistent profitability.
High Trading Frequency
Intraday trading strategies that involve high trading frequency are popular among traders who aim to take advantage of short-term price movements. These strategies require constant monitoring of the market and active buying and selling of securities within a single trading day. High trading frequency can be driven by various factors, including high volatility and market liquidity.
High volatility refers to large price fluctuations within a short period of time. This creates opportunities for intraday traders to profit from quick price changes. Market liquidity, on the other hand, refers to the ease with which an asset can be bought or sold without significantly impacting its price. Intraday traders prefer highly liquid markets as it allows them to enter and exit positions quickly.
To further understand the relationship between high volatility, market liquidity, and intraday trading strategies, consider the following table:
| High Volatility | Low Volatility | |
|---|---|---|
| High Liquidity | Ideal for intraday traders as there are ample opportunities for quick profits due to frequent price swings | May not provide enough trading opportunities for intraday traders as prices tend to be stable |
| Low Liquidity | Can lead to challenges in executing trades at desired prices due to low participation | Less suitable for intraday traders as it may limit their ability to enter or exit positions efficiently |
Tight Stop-Loss Levels
Tight stop-loss levels are utilized by traders to limit potential losses and protect their capital in case the market moves against their positions. This risk management technique involves setting predetermined price levels at which a trader will exit a trade in order to minimize losses.
Here are four reasons why tight stop loss strategies are important:
- Minimize Risk: By implementing tight stop-loss levels, traders can effectively manage and reduce the potential downside of a trade.
- Protect Capital: Tight stop-loss levels help protect a trader’s capital by ensuring that losses do not exceed a certain threshold.
- Maintain Discipline: Setting strict stop-loss levels forces traders to stick to their trading plan and avoid emotional decision-making.
- Improve Profitability: By limiting losses, tight stop-loss strategies allow for better risk-reward ratios, potentially increasing overall profitability.
Overall, utilizing tight stop-loss levels is an essential aspect of effective risk management techniques in intraday trading.
Reversal Trading
- Timing entry and exit: Timing entry and exit is crucial in reversal trading as it allows traders to maximize profits and minimize losses. By carefully analyzing market conditions, traders can determine the optimal time to enter a trade and when to exit to lock in gains or cut losses.
- Identifying trend reversals: Identifying trend reversals involves analyzing market patterns and indicators to determine when a current trend is likely to reverse. This can be done through technical analysis, such as looking for chart patterns like double tops or bottoms, or using oscillators like the Relative Strength Index (RSI) to gauge overbought or oversold conditions.
- Using technical indicators: Technical indicators can be helpful tools in reversal trading as they provide objective data that can guide decision-making processes. Traders can use indicators like moving averages, MACD (Moving Average Convergence Divergence), or Bollinger Bands to confirm potential reversals and support their trading decisions.
Timing Entry and Exit
When considering the timing of entry and exit in intraday trading strategies, it is important to carefully analyze market conditions and indicators to make informed decisions. Timing plays a crucial role in determining the success of these strategies, as entering or exiting a trade at the wrong time can result in significant losses.
Here are some key considerations for timing entry and exit:
- Market volatility: Assessing the level of market volatility helps identify optimal entry and exit points. Higher volatility may present more opportunities for profit, but also increases risk.
- Technical indicators: Utilizing technical analysis tools such as moving averages, oscillators, and trend lines can assist in identifying potential entry and exit signals.
- Price patterns: Recognizing chart patterns like breakouts or reversals can provide insights into when to enter or exit trades.
- News events: Monitoring economic calendars and news releases can help anticipate significant market movements that may affect trade timing.
Understanding these factors enables traders to develop effective timing strategies for their entries and exits.
Transitioning into the subsequent section about ‘identifying trend reversals’, it is important to consider how accurately predicting changes in price direction can further enhance intraday trading profitability.
Identifying Trend Reversals
One important aspect to consider in the analysis of intraday market movements is the identification of trend reversals. Being able to accurately identify when a trend is likely to reverse can be crucial for traders looking to enter or exit positions at favorable prices. One commonly used method for identifying trend reversals is through the use of candlestick patterns.
Candlestick patterns provide visual representations of price movements over a given time period and can offer insights into potential changes in market sentiment. By analyzing these patterns, traders can gain an understanding of the strength of a trend and make informed decisions regarding their trading strategies. The table below summarizes some common candlestick patterns and their implications:
| Pattern | Description | Bullish/Bearish Reversal |
|---|---|---|
| Hammer | A small body with a long lower wick, indicating potential bullish reversal | Bullish |
| Shooting Star | A small body with a long upper wick, indicating potential bearish reversal | Bearish |
| Engulfing | A large body that engulfs the previous candle, indicating potential reversal | Both |
Using Technical Indicators
Using technical indicators can provide traders with valuable insights into market trends and potential price reversals. These indicators are mathematical calculations applied to historical price and volume data, helping traders identify patterns and make informed trading decisions.
Here are four commonly used technical indicators:
- Moving Averages: These indicators calculate the average price over a specific period, smoothing out short-term fluctuations and providing trend direction.
- Relative Strength Index (RSI): RSI measures the strength and speed of a price movement, indicating whether an asset is overbought or oversold.
- Bollinger Bands: These bands consist of a moving average line and two standard deviation lines. They represent support and resistance levels and can help identify volatility changes.
- MACD (Moving Average Convergence Divergence): MACD shows the relationship between two moving averages, highlighting potential buy or sell signals.
Gap Trading
Gap trading is a popular intraday strategy that involves taking advantage of price gaps between the previous day’s close and the current day’s open. This strategy relies on the assumption that these price gaps will eventually be filled as the market seeks equilibrium. Gap traders analyze trends in order to identify potential opportunities for profit.
One common approach to gap trading is trend analysis, which involves studying patterns and movements in stock prices over time. By identifying trends, traders can anticipate potential price gaps and make informed decisions about when to enter or exit a trade. Trend analysis can be conducted using various technical indicators such as moving averages, relative strength index (RSI), or Bollinger Bands.
To illustrate the potential profitability of gap trading, consider the following hypothetical table:
| Stock | Previous Day Close | Current Day Open | Price Gap | Profit Potential |
|---|---|---|---|---|
| ABC | $50 | $55 | $5 | +$5 |
| XYZ | $100 | $95 | -$5 | -$5 |
| DEF | $75 | $80 | $5 | +$5 |
| MNO | $90 | $85 | -$5 | -$5 |
| RST | $60 | $65 | $5 | +$5 |
As demonstrated in this table, gap trading can yield both positive and negative outcomes depending on whether the trader correctly predicts the direction of the price gap. It is crucial for traders to conduct thorough research and analysis before implementing this strategy to increase their chances of success.
Volume Analysis
Volume analysis is a crucial aspect of technical analysis in financial markets. It provides valuable insights into the strength and sustainability of price movements. The importance of volume lies in its ability to confirm or contradict the validity of price trends, as high volume often indicates increased market participation and conviction.
Interpreting volume patterns involves analyzing changes in trading activity over time to identify potential buying or selling pressure. This information can help traders make informed decisions about entry and exit points.
Importance of Volume
The significance of volume in intraday trading can be observed through its impact on price movements and market liquidity. Volume is an essential factor for analyzing market trends and making informed trading decisions.
Here are four reasons why volume is important in intraday trading:
- Price Confirmation: High volume often confirms the direction of price movement, indicating a strong trend.
- Market Liquidity: Higher volume signifies greater market liquidity, ensuring faster execution of trades.
- Trend Reversals: Sudden spikes or drops in volume can signal potential trend reversals, providing valuable insights to traders.
- Support and Resistance Levels: Volume analysis helps identify key support and resistance levels, aiding in determining entry and exit points.
Understanding the importance of volume enables traders to make more informed decisions based on market dynamics. By interpreting volume patterns, traders can gain further insights into market behavior and enhance their intraday trading strategies.
Interpreting Volume Patterns
Interpreting volume patterns involves analyzing the relationship between trading activity and price movements in order to gain insights into market dynamics. By studying the volume of shares traded during specific time periods, traders can identify patterns that may suggest potential changes in market sentiment.
Volume analysis is a useful tool for interpreting price action, as it helps traders understand the level of interest and participation in a particular stock or market. For example, a significant increase in volume accompanied by a strong upward price movement may indicate bullish sentiment and buying pressure from investors. Conversely, low volume combined with declining prices could suggest a lack of interest or selling pressure.
Additionally, interpreting candlestick patterns alongside volume analysis can provide further confirmation or signals for potential market reversals or continuation trends.
Pivot Point Strategy
Pivot Point Strategy is a commonly used intraday trading strategy that helps traders identify potential support and resistance levels in the market. This strategy is based on pivot point calculation, which involves calculating the average of the high, low, and closing prices from the previous trading day. Traders use this average to determine key levels at which the price may reverse or continue its trend.
Here are four important techniques used in pivot point trading:
- Pivot Points: Traders use pivot points as reference levels for potential support and resistance. These points can help them make decisions on when to enter or exit trades.
- Support and Resistance Levels: By using pivot points, traders can identify areas where the price is likely to encounter support (buying pressure) or resistance (selling pressure). This information can guide their trading decisions.
- Trend Reversals: Pivot point strategy also helps traders identify potential trend reversals. If a price breaks through a pivot level with strong momentum, it may indicate a reversal in the current trend.
- Multiple Time Frames: Traders often analyze multiple time frames when using pivot point strategy. They look for alignment of key levels across different time frames to increase their confidence in potential trade setups.
Overall, pivot point strategy is a valuable tool for intraday traders as it provides objective calculations and helps them identify crucial levels where significant market movements may occur.
Fibonacci Retracement Strategy
Fibonacci retracement strategy is a widely used technical analysis tool that helps traders identify potential levels of support and resistance based on the Fibonacci sequence. This strategy is based on the premise that markets tend to retrace a portion of their previous move before continuing in the direction of the primary trend.
The Fibonacci sequence is a series of numbers where each number is the sum of the two preceding ones, starting with 0 and 1. The most commonly used Fibonacci retracement levels in trading are 38.2%, 50%, and 61.8%. These levels are derived by dividing a significant price move by these percentages.
Traders use Fibonacci retracement levels to determine areas where prices may reverse or consolidate, providing potential entry or exit points for trades. By identifying these key levels, traders can make more informed decisions about when to buy or sell securities. Additionally, Fibonacci retracement techniques can be combined with other technical indicators or chart patterns to increase their effectiveness.
It’s important to note that while Fibonacci retracement strategy has gained popularity among traders, it should not be solely relied upon as a standalone trading method. Like any technical analysis tool, it has its limitations and should be used in conjunction with other tools and strategies for optimal results.
Conclusion
In conclusion, the “10 Best Intraday Trading Strategies” empower traders to navigate the fast-paced world of intraday trading with confidence and precision. Each strategy offers a unique approach, allowing traders to capitalize on diverse market conditions. It’s crucial to remember that no single strategy guarantees success; adaptability and continuous learning are key.
As you explore these strategies, consider incorporating them into your trading plan while also maintaining a keen eye on risk management. With diligence and practice, you can leverage these techniques to enhance your intraday trading endeavors and work towards achieving your financial goals. Happy trading!
References
- Forex Analysis: An Introduction and Comparison of Fundamental and Technical Analysis
- What Makes Currencies Move? An Exploration of the Key Forces That Cause Currencies to Fluctuate
- Pitfalls and Risks: Understanding the Risks of Forex and the Mistakes that New Traders Make
- Trading Strategy: Using a Combination of Analytical Tools to Develop a Trading Strategy
Frequently Asked Questions
How Much Capital Is Required to Start Intraday Trading Using the Fibonacci Retracement Strategy?
The capital requirements for starting intraday trading using the fibonacci retracement strategy depend on various factors, such as market conditions and individual risk tolerance. Strategies for small accounts often involve managing risk effectively and utilizing leverage judiciously to maximize potential gains.
Can the Pivot Point Strategy Be Applied to Any Financial Market, Such as Stocks, Commodities, or Forex?
The effectiveness of the pivot point strategy and the pros and cons of using pivot points in intraday trading vary depending on the financial market being traded, such as stocks, commodities, or forex.
Are There Any Specific Indicators or Tools Recommended for Volume Analysis in Intraday Trading?
Specific indicators and recommended tools for volume analysis in intraday trading are important for assessing market trends and making informed decisions. Analyzing volume can provide insights into the strength of price movements and potential reversals.
What Is the Average Holding Period for Trades Executed Using the Gap Trading Strategy?
The average holding period for trades executed using the gap trading strategy is determined by various factors, such as market conditions and individual trading preferences. Further research and analysis are required to provide a specific numerical estimate.
Are There Any Particular Risk Management Techniques That Should Be Followed When Practicing Reversal Trading in Intraday Trading?
Reversal trading in intraday trading requires effective risk management techniques. Tips for managing intraday trading risks include setting stop-loss orders, diversifying the portfolio, and using technical analysis indicators to identify potential reversals.


