

Embark on a journey into the dynamic world of trading with our comprehensive guide on the “Best Trading Indicators.” These powerful tools serve as beacons, illuminating potential market movements and providing traders with invaluable insights. From moving averages to relative strength indicators, each indicator brings a unique perspective to the trading landscape.
In this guide, we dissect the most influential indicators, offering practical insights on their application and interpretation. Join us in uncovering the secrets that lie within these indicators, empowering you to make informed trading decisions and navigate the markets with confidence.
Key Takeaways
- Forex trading indicators are essential tools for making informed investment decisions in the forex market.
- Moving Averages are effective for spotting short-term opportunities and identifying long-term trends.
- Support/Resistance indicators help traders place trades based on price action analysis.
- Relative Strength Index (RSI) is useful for identifying potential turning points in price action and predicting future price direction.
What Is a Trading Indicator
A Forex trading indicator is a type of technical analysis tool used to identify potential trade opportunities. It is an algorithm-based calculation based on the price, volume, or open interest of a security or combination of securities. It helps traders determine market trends and confirm trading signals for entry and exit points.
Indicators are essential components in any trader’s toolbox as they help them make informed decisions about their trades and manage risk effectively. Forex Basics such as support and resistance levels can be determined with indicators, which also help traders assess Money Management strategies before entering into trades.
Additionally, indicators provide short-term sentiment data that can be used to predict future market movements. By combining fundamental analysis with technical indicators, traders gain a better understanding of how different markets move and how to time their entries more accurately.
Overall, forex trading indicators are invaluable tools for helping traders make more informed investment decisions in the foreign exchange market.
Best Trading Indicators
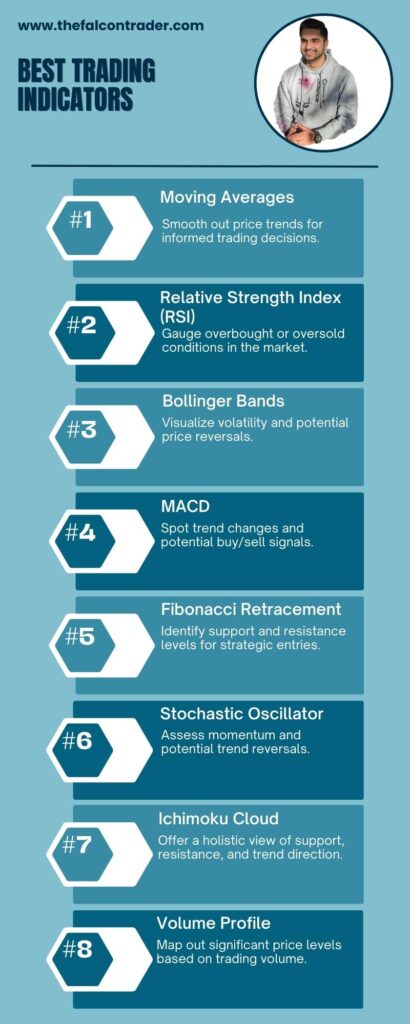
Determining the best trading indicators is subjective and depends on the trader’s strategy, preferences, and the specific market they are trading. However, several indicators are widely recognized for their effectiveness:
- Moving Averages (MA): These smooth out price data to identify trends. The Simple Moving Average (SMA) and the Exponential Moving Average (EMA) are popular choices.
- Relative Strength Index (RSI): It measures the speed and change of price movements and helps identify overbought or oversold conditions.
- Moving Average Convergence Divergence (MACD): Combining moving averages, the MACD helps identify potential buy and sell signals.
- Support/Resistance: Looks at previous highs or lows in order to identify potential areas where the pair may stall or reverse its movement.
- Bollinger Bands: These indicate volatility and price levels relative to a moving average.
- Stochastic Oscillator: It compares a security’s closing price to its price range over a given time period.
- Fibonacci Retracement: This tool identifies potential support and resistance levels based on the Fibonacci sequence.
- Volume: Analyzing trading volume provides insights into market strength and potential reversals.
Ultimately, the best indicators are those that align with a trader’s strategy, providing meaningful insights into the specific market conditions they are trading. It’s advisable to use a combination of indicators for a comprehensive view. Additionally, backtesting and practice are crucial in determining which indicators work best for an individual trader.
Moving Average
The Moving Average is a technical indicator often used in forex trading to identify trends and potential entry or exit points. It is calculated by plotting the average price of an asset over a certain period of time, usually 14 days.
This indicator helps traders assess the current trend and strength of the market based on historical data. The Moving Average can also be used to gauge price action as it relates to support and resistance levels. As prices approach either a support or resistance level, traders may apply Moving Averages to measure trend strength for possible trade entries or exits.
The use of Moving Averages is particularly beneficial in forex trading because they allow traders to capitalize on short-term fluctuations without having to manually adjust their positions every day. Additionally, this indicator allows investors to see if there are any significant changes in the market’s dynamics that they should pay attention to.
Relative Strength Index (RSI)
The Relative Strength Index (RSI) is a momentum indicator used to measure the velocity and magnitude of directional price movements.
It is calculated by taking the average of up closes over a specified period and dividing it by the average of down closes over the same period.
This number is then smoothed out using a moving average, so that it can be compared across different time frames.
The RSI is typically used as an indication of overbought and oversold conditions on a chart, as readings above 70 are generally considered to be overbought while readings below 30 are considered to be oversold.
Measurement of Momentum
Measuring momentum in the forex trading market can be a complex and time-consuming task. Technical traders often rely on indicators that measure the speed and magnitude of price movements to identify potential turning points.
This is done by using a combination of:
- Price action – analyzing changes in closing prices,
- Momentum oscillators – such as Rate of Change (ROC) or Relative Strength Index (RSI),
- Volatility tools – including Average True Range (ATR).
These indicators allow traders to better assess trends, identify potential entry and exit points, and manage risk when trading currencies on the foreign exchange market.
Momentum Indicator
Analyzing momentum in the foreign exchange market often requires the use of indicators such as Rate of Change (ROC), Relative Strength Index (RSI), and Average True Range (ATR).
Momentum divergence is an effective tool when used correctly, allowing traders to identify possible turning points in price action.
The RSI is one of the most popular indicators for measuring momentum, as it measures the speed and magnitude of price movements.
The ATR indicator helps traders to measure volatility by comparing current prices to previous highs or lows.
By combining these types of indicators, traders can quickly identify potential opportunities in the forex market based on changes in momentum.
When used properly, these indicators can help indicate when a currency pair has become overbought or oversold, providing insight into future price direction.
This transition into assessing overbought/oversold conditions leads us into our next section.
Overbought/oversold
The Overbought/Oversold indicator is a popular tool used by swing traders and those who analyze price action. It helps identify areas of overbought and oversold conditions in the market, allowing for quick entry and exit points for potential trades. This type of trading is based on the idea that when a currency pair moves to extreme high or low levels, it will eventually revert back to its mean or average level.
To identify such trends, we must first understand three key components:
- The current price level relative to historical highs/lows;
- The momentum of the move (direction);
- Volume indications from various sources such as money flow index (MFI).
Using these parameters, traders can decide whether an asset is either overbought or oversold and then make decisions about entering into trades accordingly.
Support/Resistance
Support and resistance are two of the most commonly used technical indicators to analyze price movements in the foreign exchange market. These levels provide an indication of potential turning points in price action, allowing traders to place trades accordingly.
The key elements of support/resistance include:
- Macd Divergence: Identifying when a trend is likely to reverse by using momentum oscillators such as MACD.
- Price Action: Examining how prices have reacted at previous levels of support or resistance to determine whether they will hold or fail this time around.
- Breakouts: Waiting for a breakout above or below these levels before entering a trade, as the move may indicate a change in direction for that currency pair going forward.
Bollinger Bands
Developed by John Bollinger, Bollinger Bands are a type of technical indicator that measure market volatility. They are composed of three bands: an upper band, a middle band, and a lower band.
The latter two represent the 20-day Simple Moving Average (SMA) with standard deviations that determine the width of these bands.
Swing trading is often used in combination with this indicator as it signals when to enter or exit trades according to price action at these bands. When the underlying asset’s price touches or goes beyond either of the bands, it is seen as an indication for traders to take action based on their technical analysis strategy.
In other words, if the asset’s price moves outside one of the bands, then it can indicate a possible overbought/oversold condition which could be an opportunity for short-term profits.
This transition into parabolic stop and reverse will further explore how this indicator works and its practical applications in trading.
Parabolic Stop and Reverse
Parabolic Stop and Reverse is a technical trading system used to identify areas of potential price reversals in the financial markets. It works by plotting points where a currency pair has experienced high levels of volatility, which indicates that there may be an opportunity for traders to capitalize on a potential reversal. This system can be used in both macro trading and short-term strategies, making it one of the most versatile indicators available.
The main features of this indicator include:
- The ability to identify areas where price is likely to reverse
- A visual display that helps traders determine when entry or exit points should be set
- Automated signal generation to alert traders when an opportunity arises for them to enter or exit the market with maximum profits.
The Parabolic Stop and Reverse is an effective tool for both novice and experienced traders alike as it provides easy-to-follow signals without requiring much analysis from the trader’s end. It also can provide some insight into longer-term trends, which can help inform decisions about whether or not to enter a trade on certain currency pairs at particular times.
Additionally, because this indicator depends heavily on volatility, its accuracy increases during volatile periods in the market, making it a great choice for traders who want an edge over other investors who may not have access to such information.
Fibonacci Retracement
Fibonacci Retracement is a technical analysis tool used to identify potential support and resistance levels in the financial markets. It is based on the Fibonacci sequence and uses horizontal lines to indicate areas of support or resistance. This tool can be used as part of a breakout strategy, helping traders determine where to place stop-loss and take-profit orders. Additionally, it can be incorporated into money management strategies, allowing traders to better manage their risk profile.
| Support Levels | Resistance Levels | |
|---|---|---|
| 23% | Strong | Strong |
| 38% | Medium | Medium |
| 50% | Weak | Weak |
It is important for traders to recognize that Fibonacci Retracement is not a trading system; rather, it is an indicator intended to help you make more informed decisions about when buying or selling may be appropriate. By understanding how this tool works and incorporating it into their trading plan, traders can improve their overall performance in the foreign exchange market.
Ichimoku Cloud
Ichimoku Cloud is a technical analysis tool used to identify potential support and resistance levels in the financial markets. It consists of five lines, namely: The Conversion Line (Tenkan-Sen), The Base Line (Kijun-Sen), The Leading Span A, The Leading Span B, and the Lagging Span. Through these components, traders are able to quickly determine key areas for entering or exiting a trade. Additionally, it can be used as an indicator of trend direction as well as momentum.
When using the Ichimoku Cloud trading strategy, traders should focus on three main elements: 1) Identifying potential turning points; 2) Determining trend direction; 3) Money management and risk management strategies. By combining these three elements, investors can create effective trading strategies that may provide more consistent returns over time. Additionally, it is important to consider how different indicators work together when using Ichimoku Cloud in order to maximize profits while minimizing losses.
Overall, Ichimoku Cloud is a powerful tool for both novice and experienced traders who want to build efficient trading strategies with money management principles incorporated into their plans. With its ability to identify support and resistance levels quickly and easily, this indicator has become increasingly popular among forex traders looking for reliable signals in the financial markets.
Conclusion
In conclusion, the “Best Trading Indicators” serve as invaluable compasses in the complex world of trading. Their ability to decode market signals and offer strategic insights is unparalleled. However, it’s crucial to remember that no single indicator holds all the answers. A judicious combination of indicators tailored to your trading style and goals can be the key to success.
As you delve into the world of trading, let this guide be your trusted companion, providing you with the knowledge and tools needed to harness the full potential of these indicators. With diligence and a strategic approach, you can leverage these indicators to enhance your trading endeavors and achieve your financial objectives.
References
- Why has FX trading surged? Explaining the 2004 triennial survey
- Computational learning techniques for intraday FX trading using popular technical indicators
- Heuristic based trading system on Forex data using technical indicator rules
- Technical indicators for forex forecasting: a preliminary study
Frequently Asked Questions
What Is the Best Forex Trading Indicator for Beginners?
Beginners in forex trading should focus on analyzing risks and managing expectations. It is important to understand market movements and the effects of different indicators in order to develop a successful trading strategy. A combination of various technical indicators can be used to identify potential entry and exit points, helping traders increase their profits while minimizing losses.
How Can I Use Forex Trading Indicators to Develop a Profitable Trading Strategy?
Effectively managing money and risk are key components to developing a profitable trading strategy. Utilizing forex indicators in the right manner enables traders to make educated decisions, increasing chances of success. By understanding how to interpret data properly, investors can gain insight into market movements and make informed decisions that result in maximum financial gains.
Are Forex Trading Indicators Based on Technical Analysis or Fundamental Analysis?
Forex trading indicators are typically based on either fundamental or technical analysis. Fundamental analysis focuses on interpreting sentiment and economic data, while technical analysis involves charting and predicting future price movements. Both approaches can be used to develop profitable trading strategies.
Are Forex Trading Indicators Suitable for Day Trading?
Like a kaleidoscope, day trading can be unpredictable due to emotional trading and market psychology. Forex indicators are suitable tools for day traders as they provide insight into market behaviour. However, traders must be aware that indicator signals should not be taken at face value – it is important to understand the underlying market conditions.
How Can I Determine Which Forex Trading Indicator Is the Most Reliable?
To determine which forex trading indicator is the most reliable, one should consider factors such as price action and sentiment analysis. This will provide an insight into how prices are likely to change in the future, allowing for a more informed decision-making process. Analyzing these indicators in detail can help build a better understanding of the market and enhance long-term success.


